
19.3 Punnett Squares and Laws of Probability
Probability Basics
Probabilities are mathematical measures of likelihood. A probability of one for some event indicates that it is guaranteed to occur, whereas a probability of zero indicates that it is guaranteed not to occur. An example of a genetic event is a round seed being produced by a pea plant.
In one experiment, Mendel demonstrated that the probability of the event “round seed” occurring was one in the F1 offspring of true-breeding parents, one of which has round seeds and one of which has wrinkled seeds. When the F1 plants were subsequently self-crossed, the probability of any given F2 offspring having round seeds was now three out of four. In other words, in a large population of F2 offspring chosen at random, 75 percent were expected to have round seeds, whereas 25 percent were expected to have wrinkled seeds. Using large numbers of crosses, Mendel was able to calculate probabilities and use these to predict the outcomes of other crosses.
The Product Rule and Sum Rule
Mendel demonstrated that pea plants transmit characteristics as discrete units from parent to offspring. As will be discussed, Mendel also determined that different characteristics, like seed color and seed texture, were transmitted independently of one another and could be considered in separate probability analyses. For instance, performing a cross between a plant with green, wrinkled seeds and a plant with yellow, round seeds still produced offspring that had a 3:1 ratio of yellow:green seeds (ignoring seed texture) and a 3:1 ratio of round:wrinkled seeds (ignoring seed color). The characteristics of color and texture did not influence each other.
The product rule of probability can be applied to this phenomenon of the independent transmission of characteristics. The product rule states that the probability of two independent events occurring together can be calculated by multiplying the individual probabilities of each event occurring alone.
To demonstrate the product rule, imagine that you are rolling a six-sided die and flipping a penny at the same time. The die may roll any number from 1–6 , whereas the penny may turn up heads or tails. The outcome of rolling the die has no effect on the outcome of flipping the penny and vice versa. There are 12 possible outcomes of this action, and each event is expected to occur with equal probability.
Of the 12 possible outcomes, the die has a 1/6 probability of rolling a two, and the penny has a 1/2 probability of coming up heads. By the product rule, the probability that you will obtain the combined outcome “2” and “heads” is:

Notice the word “and” in the description of the probability. The “and” is a signal to apply the product rule. For example, consider how the product rule is applied to the probability of having two dominant traits specified by two different genes (for example, yellow and round) in the F2 progeny is the product of the probabilities of having the dominant trait for each characteristic, as shown here:

On the other hand, the sum rule of probability is applied when considering two mutually exclusive outcomes that can come about by more than one pathway. The sum rule states that the probability of the occurrence of one event or the other event, of two mutually exclusive events, is the sum of their individual probabilities. Notice the word “or” in the description of the probability. The “or” indicates that you should apply the sum rule. In this case, let’s imagine you are flipping a penny (P) and a quarter (Q). What is the probability of one coin coming up heads and one coin coming up tails? This outcome can be achieved by two cases: the penny may be heads (PH) and the quarter may be tails (QT), or the quarter may be heads (QH) and the penny may be tails (PT). Either case fulfills the outcome. By the sum rule, we calculate the probability of obtaining one head and one tail as:

You should also notice that we used the product rule to calculate the probability of PH and QT, and also the probability of PT and QH, before we summed them.
The Punnett Square Approach for a Monohybrid Cross
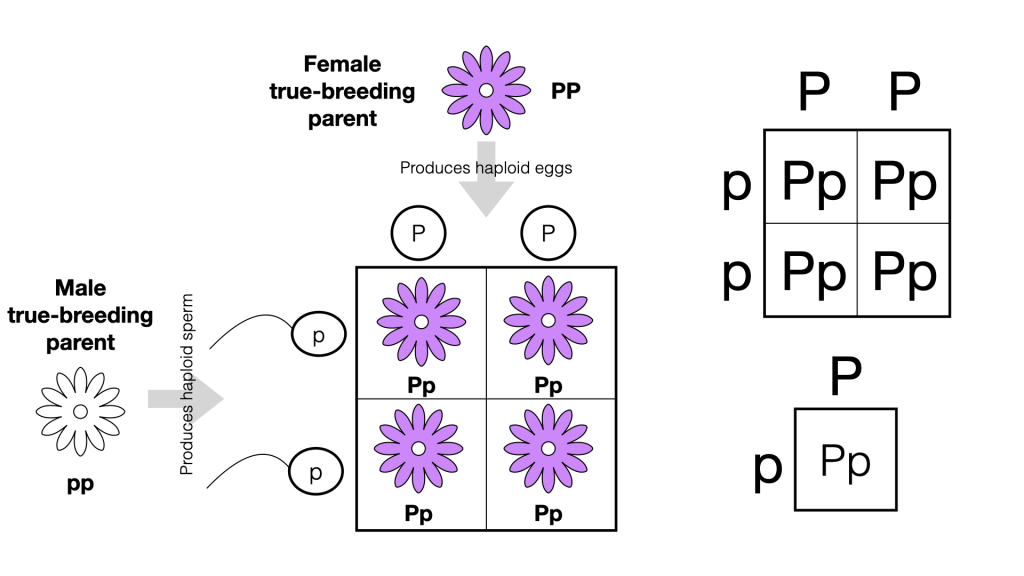
When fertilization occurs between two true-breeding parents that differ in only one characteristic, the process is called a monohybrid cross, and the resulting offspring are monohybrids. To demonstrate a monohybrid cross, consider the case of true-breeding pea plants with purple flowers versus white flowers. The dominant flower color is purple; therefore, the parental genotypes were PP for the plants with purple flowers and pp for the plants with white flowers.
A Punnett square, devised by the British geneticist Reginald Punnett, can be drawn that applies the rules of probability to predict the possible outcomes of a genetic cross or mating and their expected frequencies. To prepare a Punnett square, all possible gamete types from one parent are listed along the top, and all possible gamete types from the other parent are listed down the left side of the grid, representing their haploid gametes (eggs or sperm).
Then the combinations of egg and sperm are made in the boxes in the table to show which alleles are combining to make diploid offspring. Each box then represents the diploid genotype of a zygote, or fertilized egg, that could result from this mating. Because each possibility is equally likely, genotypic ratios can be determined from a Punnett square. If the pattern of inheritance (dominant or recessive) is known, the phenotypic ratios can be inferred as well. For a monohybrid cross of two true-breeding parents, each parent contributes one type of allele. In this case, all offspring are Pp and have purple flowers.
A self-cross of one of the Pp heterozygous offspring can be represented in a 2 × 2 Punnett square because each parent can donate one of two different alleles. Therefore, the offspring can potentially have one of four allele combinations: PP, Pp, pP, or pp. Notice that there are two ways to obtain the Pp genotype: a P from the egg and a p from the sperm, or a p from the egg and a P from the sperm.
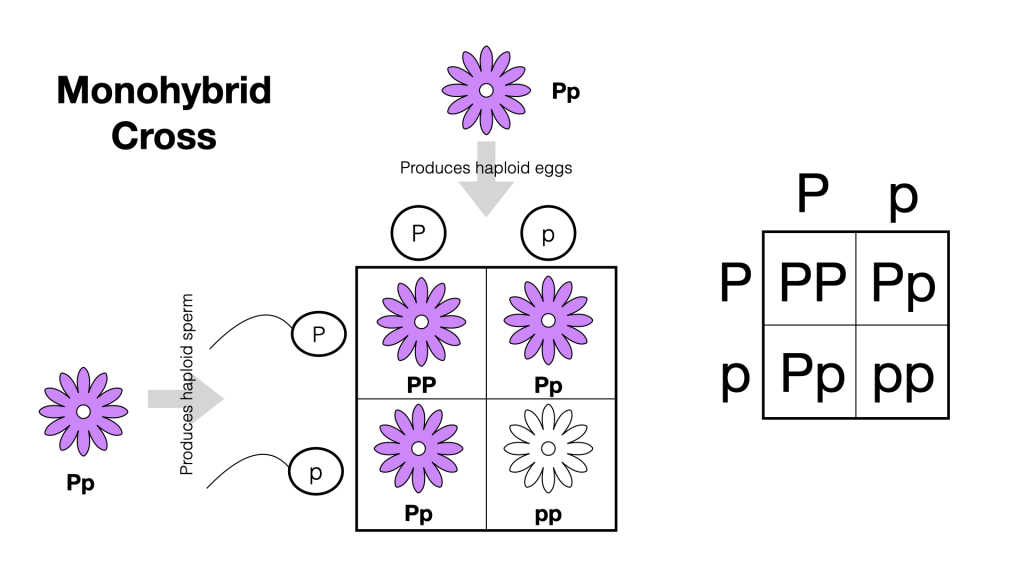
Both of these ways to obtain a heterozygous offspring must be considered. The two possible heterozygous combinations produce offspring that are genotypically and phenotypically identical despite their dominant and recessive alleles being derived from different parents. Therefore, they are grouped together. Because fertilization is a random event, we expect each combination to be equally likely and for the offspring to exhibit a genotype ratio of 1 PP: 2 Pp : 1 pp. Furthermore, because the PP and Pp offspring have purple flowers and are phenotypically identical, applying the sum rule of probability, we expect the offspring to exhibit a phenotypic ratio of 3 purple:1 white. Indeed, working with large sample sizes, Mendel observed approximately this same ratio in the F2 generation for all seven characteristics that he studied.
probability of two independent events occurring simultaneously can be calculated by multiplying the individual probabilities of each event occurring alone
probability of the occurrence of at least one of two mutually exclusive events is the sum of their individual probabilities
a cross between two true-breeding parents that express different traits for one characteristic
