
Tectonic Forces
4.3 Measuring and Locating Earthquakes
Focus and Epicenter
The focus, also called a hypocenter of an earthquake, is the point of initial breaking or rupturing where the displacement of rocks occurs. The focus is always at some depth below the ground surface in the crust and not at the surface. The displacement propagates up, down, and laterally along the fault plane from the focus. The displacement produces shock waves and creates seismic waves. The larger the displacement and the further it propagates, the more significant the seismic waves and ground shaking. More shaking is usually the result of more seismic energy released. The epicenter is on the Earth’s surface vertically above the point of rupture (focus). The epicenter is also where most news reports are because it is the center where people are affected. The focus is the point along the fault plane from which the seismic waves spread outward. (9 Crustal Deformation and Earthquakes – An Introduction to Geology, n.d.)
Seismic Waves
Seismic waves express the energy released after an earthquake in the form of body waves and surface waves. When seismic energy is released, the first waves to propagate are body waves passing through the planet’s body. Body waves include primary waves (P waves) and secondary waves (S waves). Primary waves are the fastest seismic waves. They move through the rock via compression, like sound waves moving through the air. Particles of rock move forward and back during the passage of the P waves. Primary waves can travel through both fluids and solids. Secondary waves travel slower and follow primary waves, propagating as shear waves. Particles of rock move from side to side during the passage of S waves. Because of this, secondary waves cannot travel through liquids, plasma, or gas.
When an earthquake occurs at a location in the Earth, the body waves radiate outward, passing through the woEarthld and into the rock of the mantle. A point on this spreading wave-front travels along a specific path that reaches a seismograph at one of the thousands of seismic stations scattered over the Earth. That specific travel path is a line called a seismic ray. Since the mantle’s density (and seismic velocity) increases with depth, refraction causes earthquake rays to curve away from the vertical and bend back toward the surface, passing through rock bodies along the way.
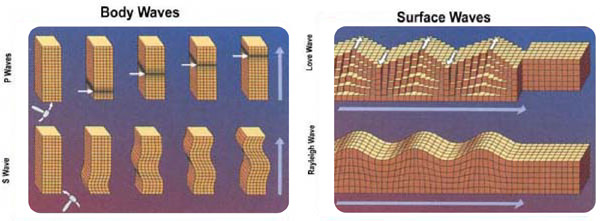
Surface waves are produced when P and S body waves strike the Earth’s surface and travel along it, radiating outward from the epicenter. Surface waves travel more slowly than body waves. They have complex horizontal and vertical ground movements that create a rolling motion. Because they propagate at the surface and have complex motions, surface waves are responsible for most damage. Two types of surface waves are Love waves and Rayleigh waves. Love waves produce horizontal ground shaking and are the most destructive, ironically, from their name. Rayleigh waves make an elliptical motion of points on the surface, with longitudinal dilation and compression, like ocean waves. However, rock particles move in a direction opposite to water particles in ocean waves with Raleigh waves. (9 Crustal Deformation and Earthquakes – An Introduction to Geology, n.d.)
Earth is like a bell, and an earthquake is a way to ring it. Like other waves, seismic waves bend and bounce when passing from one material to another, like moving from a dense rock to a rock with even higher density. When a wave bends as it moves into a different substance, it is known as refraction, and when waves bounce back, it is known as reflection. Because S waves cannot move through a liquid, they are blocked by the liquid outer core, creating a shadow zone on the side of the planet opposite to the earthquake source.
Seismographs
Seismographs are instruments used to measure seismic waves. They measure the vibration of the ground using pendulums or springs. The seismograph principle involves mounting a recording device solidly to the Earth and suspending a pen or writing instrument above it on a spring or pendulum. As the ground shakes, the suspended pen records the shaking on the recording device. The graph resulting from measurements of a seismograph is a seismogram. Seismographs of the early 20th century were primarily springs or pendulums with pens written on a rotating drum of paper. Digital ones now use magnets and wire coils to measure ground motion. Typical seismograph arrays measure vibrations in three directions: north-south (x), east-west (y), and up-down (z).
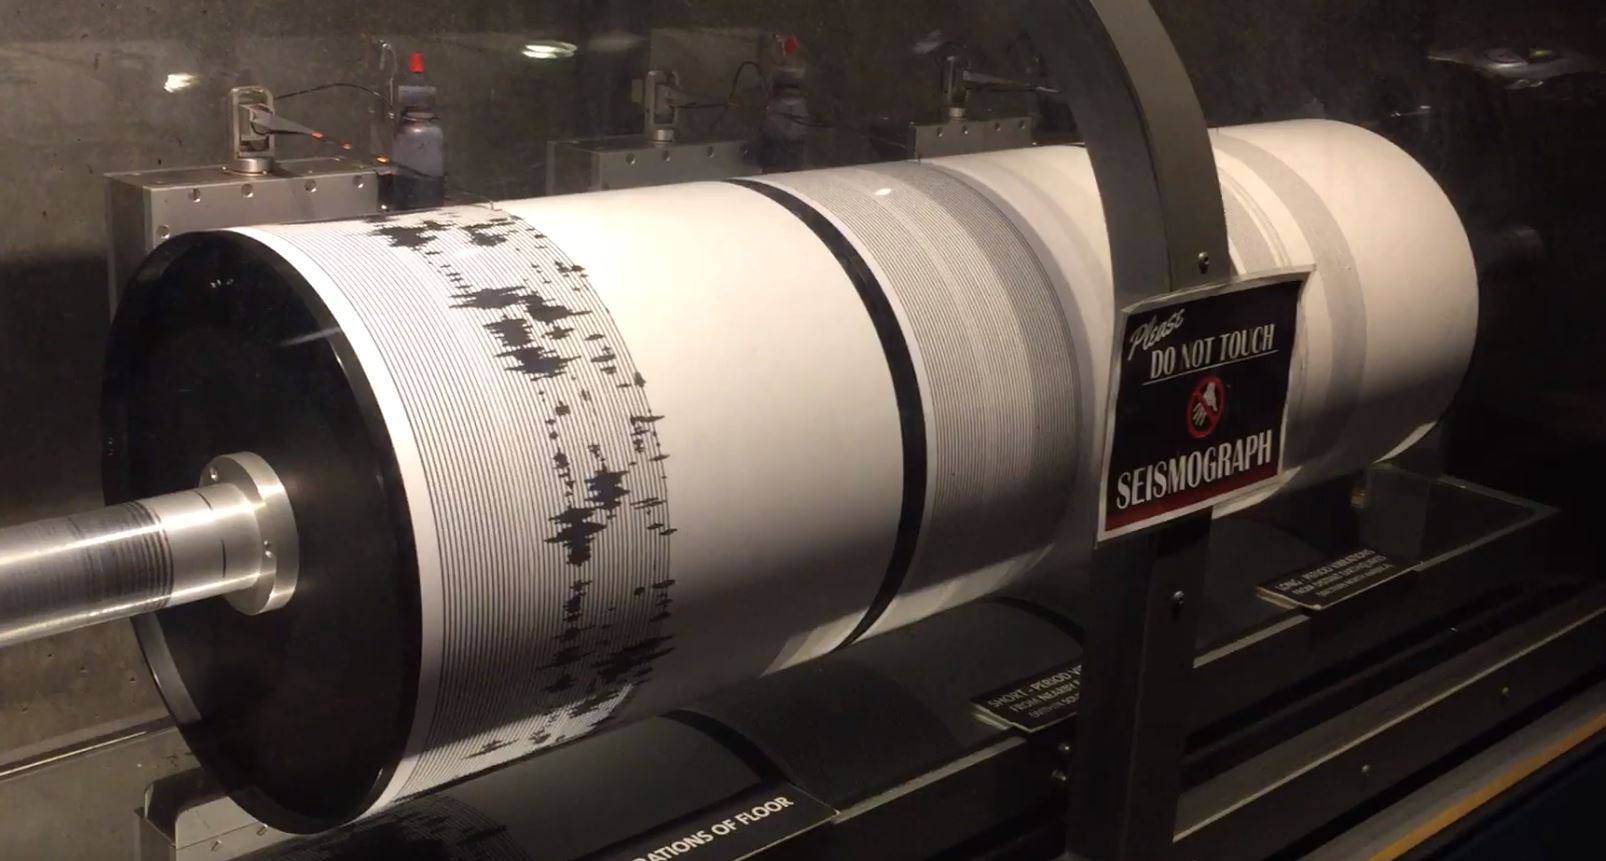
To determine the distance of the seismograph from the epicenter, seismologists use the difference between when the first P waves and S waves arrive. After an earthquake, P waves will appear first on the seismogram, followed by S waves, and finally, body waves, which have the largest amplitude on the seismogram. Surface waves lose energy quickly and are not measured at great distances from the focus. Seismograph technology across the globe records the arrival of seismic waves from each earthquake at many station sites. The distance to the epicenter can be determined by comparing the arrival times of the P and S waves. Electronic communication among seismic stations and connected computers used to make calculations means earthquakes and news reports are generated quickly in the modern world. (9 Crustal Deformation and Earthquakes – An Introduction to Geology, n.d.)
Locating Earthquakes
Each seismograph gives the distance from that station to the earthquake epicenter. Three or more seismograph stations are needed to locate the epicenter of an earthquake through triangulation. Using the arrival-time difference from the first P wave to the first S wave, one can determine the distance from the epicenter but not the direction. The distance from the epicenter to each station can be plotted as a circle, equal to the circle’s radius. The place where the circles intersect demarks the epicenter. This method works in three dimensions with spheres and multi-axis seismographs to locate the epicenter and the depth of the earthquake’s focus.
Seismograph Network
The International Registry of Seismograph Stations lists more than 20,000 seismographs on the planet. Seismologists can use and compare seismograph network data from multiple seismometers dispersed over a wide area. By collaborating, scientists can map the inside of the Earth’s properties, detect large explosive devices, and predict tsunamis. The Global Seismograph Network, a set of worldwide linked seismographs that distribute real-time data electronically, has more than 150 stations that meet specific design and precision standards. The Global Seismograph Network helps the Comprehensive Nuclear Test Ban Treaty Organization monitor nuclear tests. The USArray is a network of hundreds of permanent and transportable seismographs within the United States. The USArray maps the subsurface through a passive collection of seismic waves created by earthquakes. (9 Crustal Deformation and Earthquakes – An Introduction to Geology, n.d.)
Determining Earthquake Magnitudes
Richter Scale
Magnitude is the measure of the intensity of an earthquake. The Richter scale is the most well-known magnitude scale devised for an earthquake and was developed by Charles Richter at CalTech. This was the magnitude scale used historically by early seismologists. The Richter scale magnitude is determined from measurements on a seismogram. Magnitudes on the Richter scale are based on the maximum amplitude of the needle trace measured on the seismogram and the arrival time difference of S and P waves, which gives the distance to the earthquake. (9 Crustal Deformation and Earthquakes – An Introduction to Geology, n.d.)
The Richter scale is a logarithmic scale based on powers of 10. The seismic wave amplitude recorded on the seismogram is ten times greater for each increase of 1 unit on the Richter scale. That means a magnitude six earthquake shakes the ground ten times more than a magnitude 5. However, the energy released for each 1-unit magnitude increase is 32 times greater. That means energy released from a magnitude six earthquake is 32 times greater than a magnitude five earthquake. The Richter scale was developed for distances appropriate for earthquakes in Southern California and on seismograph machines in use there. Its applications to more considerable distances and massive earthquakes are limited. Therefore, most agencies no longer use Richter’s methods to determine the magnitude but generate a quantity called the Moment Magnitude, which is more accurate for large earthquakes measured at the seismic array across the Earth. The moment magnitudes are comparable to the magnitudes of the Richter Scale. The media still often give magnitudes as Richter Magnitude even though the actual calculation was moment magnitude.
Moment Magnitude Scale
The Moment Magnitude Scale depicts the absolute size of earthquakes, comparing information from multiple locations and using a measurement of actual energy released calculated from the cross-sectional area of rupture, amount of slippage, and the rigidity of the rocks. Because each earthquake’s unique geologic setting and the rupture area are often challenging to measure, estimates of moment magnitude can take days to months to calculate. (9 Crustal Deformation and Earthquakes – An Introduction to Geology, n.d.)
Like the Richter magnitude, the moment magnitude scale is logarithmic. Both scales are used in tandem because the magnitude estimates may change after a quake. The Richter scale is used as a quick determination immediately following the earthquake (and is usually reported in news accounts), and the moment magnitude is calculated days to months later. The magnitude values of the two magnitudes are approximately equal except for massive earthquakes.
Modified Mercalli-Intensity Scale
The Modified Mercalli Intensity Scale is a qualitative scale (I-XII) of the intensity of ground shaking based on damage to structures and people’s perceptions. This scale can vary depending on the location and population density (urban vs. rural). It was also used for historical earthquakes before quantitative magnitude measurements. The Modified Mercalli Intensity maps show the most severe damage based on questionnaires sent to residents, newspaper articles, and reports from assessment teams. Recently, USGS has used the internet to help gather data more quickly.
Shakemaps (written ShakeMaps by the USGS) uses high-quality seismograph data from seismic networks to show areas of intense shaking. They are the result of rapid, computer-interpolated seismograph data. They are helpful in crucial minutes after an earthquake, as they can show emergency personnel where the most significant damage likely occurred and locate areas of possible damaged gas lines and other utilities.

