
Introduction to Geographic Science
1.3 Geographic Literacy
Spatial Thinking
At no other time in the history of the world has it been easier to create or acquire a map of anything? Maps and mapping technology are literally and virtually everywhere. Though the modes and means of making and distributing maps have been revolutionized with recent advances in computing like the Internet, the art and science of map-making date back centuries. This is because humans are inherently spatial organisms, and for us to live in the world, we must somehow relate to it. Enter the mental map.
Mental Maps
Mental or cognitive maps are psychological tools that we all use every day. As the name suggests, mental maps are maps of our environment stored in our brains. We rely on our mental maps to get from one place to another, plan our daily activities, or understand and situate events we hear about from our friends, family, or the news. Mental maps also reflect the amount and extent of our geographic knowledge and spatial awareness.
Mental maps tend to have the following characteristics:
- Mental maps illustrate what we know about the places we live in. They are rough “sketches” or ideas of our geographic knowledge of an area.
- Mental maps highlight how we relate to our local environment.
- What we choose to include and exclude on our map provides insights into what places we think are important and how we move through our places of residence.
- When we compare our mental maps to someone else’s from the same place, certain similarities emerge that shed light on how humans think spatially and organize geographical information in our minds.
What we include and omit on our mental maps, by choice or not, speaks volumes about our geographical knowledge and spatial awareness. Recognizing and identifying what we do not know is essential to learning. Only when we identify the unknown can we ask questions, collect information to answer those questions, develop knowledge through answers, and begin understanding the world where we live.
Asking Geographic Questions
Filling in the gaps in our mental maps and, more generally, the gap in our geographic knowledge requires us to ask questions about the world where we live and how we relate to it. Such questions can be simple with a local focus (e.g., “Which way is the nearest hospital?”) or more complex with a more global perspective (e.g., “How is urbanization impacting biodiversity hotspots around the world?”). The thread that unifies such questions is geography. For instance, the question of “where?” is an essential part of the question “Where is the nearest hospital?” and “Where are the biodiversity hotspots concerning cities?” Articulating questions clearly and breaking them into manageable pieces are valuable when using and applying a geographic information system (GIS).
Though there may be no such thing as a “dumb” question, some questions are indeed better than others. Learning to ask the right question takes practice and is often more difficult than finding the answer. However, when we ask the right questions, problems are more easily solved, and our understanding of the world is improved. There are five general types of geographic questions that we can ask and that GIS can help us to answer. Each type of question is listed here and followed by a few examples (Nyerges 1991). Nyerges, T. 1991. “Analytical Map Use.” Cartography and Geographic Information Systems (formerly The American Cartographer) 18: 11–22.
Questions about geographic location:
- Where is it?
- Why is it here or there?
- How much of it is here or there?
Questions about geographic distribution:
- Is it distributed locally or globally?
- Is it spatially clustered or dispersed?
- Where are the boundaries?
Questions about the geographic association:
- What else is near it?
- What else occurs with it?
- What is absent in its presence?
Questions about geographic interaction:
- Is it linked to something else?
- What is the nature of this association?
- How much interaction occurs between the locations?
Questions about geographic change:
- Has it always been here?
- How has it changed over time and space?
- What causes its diffusion or contraction?
People from various areas of expertise, industries, and professions frequently ask these and related geographic questions. For instance, urban planners, traffic engineers, and demographers may be interested in understanding the commuting patterns between cities and suburbs (geographic interaction). Biologists and botanists may wonder why one animal or plant species flourish in one place, not another (geographic location/distribution). Epidemiologists and public health officials are interested in where disease outbreaks occur and how, why, and where they spread (geographic change/interaction/location).
A geographic information system (GIS) can assist in answering all these questions and many more. Furthermore, GIS often opens additional avenues of inquiry when searching for answers to geographic questions. Herein is one of GIS’s greatest strengths. While GIS can be used to answer specific questions or to solve problems, it often unearths even more exciting questions. It presents more problems to be solved in the future.
Geographic Inquiry
Geography is the study of the physical and cultural environments of the Earth. Geography differs from other disciplines because it focuses on spatial inquiry and analysis. Geographers also try to find connections between patterns, movement and migration, trends, etc. This process is called a geographic or spatial inquiry.
To do this, geographers go through a geographic methodology like the scientific method but again with a geographic or spatial emphasis. This method can be simplified in a six-step geographic inquiry process.
- Ask a geographic question. This means asking questions about spatial relationships in the world around you.
- Acquire geographic resources. Identify data and information that you need to answer your question.
- Explore geographic data. Turn the data into maps, tables, and graphs, and look for patterns and relationships.
- Analyze geographic information. Determine what the patterns and relationships mean concerning your question.
“Knowing where something is, how its location influences its characteristics, and how it influences relationships with other phenomena are the foundation of geographic thinking. This mode of investigation asks you to see the world and all that is in it in spatial terms. Like other research methods, it asks you to explore, analyze, and act upon your findings. It also is important to recognize that this is the same method used by professionals worldwide working to address social, economic, political, environmental, and a range of scientific issues” (ESRI).
Geographic Concepts
Before learning to think geographically and apply spatial thinking, we must review and reconsider a few critical geographic concepts often taken for granted. For instance, what is a location, and how can it be defined? At what distance does a location become “nearby”? Or what do we mean when we say someone has a “good sense of direction”? By answering these and related questions, we establish a framework that will help us learn and apply GIS. This framework will also permit us to share and communicate geographic information, facilitating collaboration, problem-solving, and decision-making.
Scale
When representing the Earth on a manageable-sized map, the actual size of the location is reduced. Scale refers to the general scope or extent of things. It is the size of the area represented by a map. The scale on a map shows the size of the area represented by the map. For example, a scale of 1:10,000 on a map means that 1 mm on the map is the same as 10,000 mm in reality. Scale can sometimes be confusing, so it is important to remember that it refers to a ratio. It does not refer to the size of the map itself, but rather, how zoomed in or out the map is. A 1:1 scale map of your room would be the same size as your room – plenty of room for significant detail, but hard to fit into a glove compartment.
Location
The one concept distinguishing geography from other fields is location, central to GIS. Location refers to a position on the Earth. What is more, everything can be assigned a geographic location. Once we know the location of something, we can put it on a map, for example, with mapping technology such as a geographic information system (GIS). We define and describe locations in nominal or absolute terms. In the case of the former, locations are determined and described by name. For example, city names such as New York, Tokyo, or London refer to nominal locations. Toponymy, or the study of place names and their respective history and meanings, is concerned with such nominal locations.
Though we associate location with points on the Earth’s surface, locations can also refer to geographic features (e.g., Rocky Mountains) or large areas (e.g., Siberia). The United States Board on Geographic Names maintains geographic naming standards and keeps track of such names through the Geographic Names Information Systems. The GNIS database also provides information about which state and county the feature is located and its geographic coordinates.
Contrasting nominal locations are absolute locations that use some reference system to define positions on the Earth’s surface. For instance, defining a location on the Earth’s surface using latitude and longitude is an example of an absolute location. Postal codes and street addresses are other absolute locations that usually follow local logic. Though there is no global standard for street addresses, we can determine the geographic coordinates (i.e., latitude and longitude) of particular street addresses, zip codes, place names, and other geographic data through geocoding. Several free online geocoders return the latitude and longitude for various locations and addresses worldwide.
With the advent of the global positioning system (GPS), determining the location of nearly any object on the Earth’s surface is a relatively simple and straightforward exercise. GPS technology consists of a constellation of twenty-four satellites orbiting the Earth and continuously transmitting time signals. To determine a position, earth-based GPS units (e.g., handheld devices, car navigation systems, mobile phones) receive the signals from at least three of these satellites and use this information to triangulate a location. All GPS units report location using the geographic coordinate system (GCS). Initially developed by the United States Department of Defense for military purposes, GPS now has various commercial and scientific uses.
Location can also be defined in relative terms. Relative location refers to defining and describing places about other known locations. For instance, Cairo, Egypt, is north of Johannesburg, South Africa; New Zealand is southeast of Australia; and Kabul, Afghanistan, is northwest of Lahore, Pakistan. Unlike nominal or absolute locations that define single points, relative locations provide more information and situate one place about another.
Direction
Like location, the concept of direction is central to geography and GIS. Direction refers to the position of something relative to something else, usually along a line. A reference point or benchmark from which direction will be measured must be established to determine direction. One of the most common benchmarks used to determine direction is ourselves. Egocentric direction refers to when we use ourselves as a directional benchmark. Describing something as “to my left,” “behind me,” or “next to me” are examples of egocentric direction.
As the name suggests, landmark direction uses a known landmark or geographic feature as a benchmark to determine direction. Such landmarks may be a busy intersection of a city, a prominent point of interest like the Colosseum in Rome, or some other feature like a mountain range or river. The critical thing to remember about landmark direction, especially when providing directions, is that the landmark should be well-known.
In geography and GIS, three more standard benchmarks define the directions of true north, magnetic north, and grid north. True north is based on the point at which the axis of the Earth’s rotation intersects the Earth’s surface. In this respect, the North and South Poles are the geographic benchmarks for determining direction. Magnetic north (and south) refers to the point on the Earth’s surface where the Earth’s magnetic fields converge. This is also the point to which magnetic compasses point. Note that magnetic north falls somewhere in northern Canada and is not geographically coincident with true north or the North Pole. Grid north refers to the northward direction that the grid lines of latitude and longitude on a map, called a graticule, point to.
Distance
Complementing the concepts of location and direction is distance. Distance is the degree or amount of separation between locations and can be measured in nominal or absolute terms with various units. We can describe the distances between locations nominally as “large” or “small,” or we can define two or more locations as “near” or “far apart.”
Calculating the distance between two locations on the Earth’s surface can be pretty involving because we are dealing with a three-dimensional object. Moving from the three-dimensional Earth to two-dimensional maps on paper, computer screens, and mobile devices is not trivial. It is discussed in greater detail in a later chapter.
We also use a variety of units to measure distance. For instance, the distance between London and Singapore can be measured in miles, kilometers, flight time on a jumbo jet, or days on a cargo ship. Whether or not such distances make London and Singapore “near” or “far” from each other is a matter of opinion, experience, and patience. Hence, using absolute distance metrics, such as that derived from the distance formula, provides a standardized method to measure how far away or how close locations are from each other.
Space
Where distance suggests a measurable quantity regarding how far apart locations are situated, space is a more abstract concept that is more commonly described rather than measured. For example, space can be described as “empty,” “public,” or “private.” Within digital mapping or GIS, we are interested in space, what fills specific spaces, and how and why things are distributed across space. In this sense, space is an ambiguous and generic term used to denote the general geographic area of interest.
One kind of space that is of relevance to a GIS is topological space. Topological space is concerned with the nature of relationships and the connectivity of locations within a given space. What is essential within topological space are (1) how locations are (or are not) related or connected and (2) the rules that govern such geographic relationships.
Transportation maps, such as those for subways, provide some of the best illustrations of topological spaces. When using maps, we are primarily concerned with how to get from one stop to another along a transportation network. Specific rules also govern how we can travel along the network (e.g., transferring lines is possible only at a few key stops; we can travel only one direction on a particular line). Such maps may be useless when traveling around a city by car or foot. However, they show the local transportation network and how locations are linked together effectively and efficiently.
Navigation
As previously discussed, transportation maps illustrate how we move through the environments where we live, work, and play. This movement, particularly destination-oriented travel, is referred to as navigation. Navigating through space is a complex process that blends our various motor skills, technology, mental maps, and awareness of locations, distances, directions, and the space we live in. Moreover, our geographical knowledge and spatial understanding are continuously updated and changed as we move from one location to another.
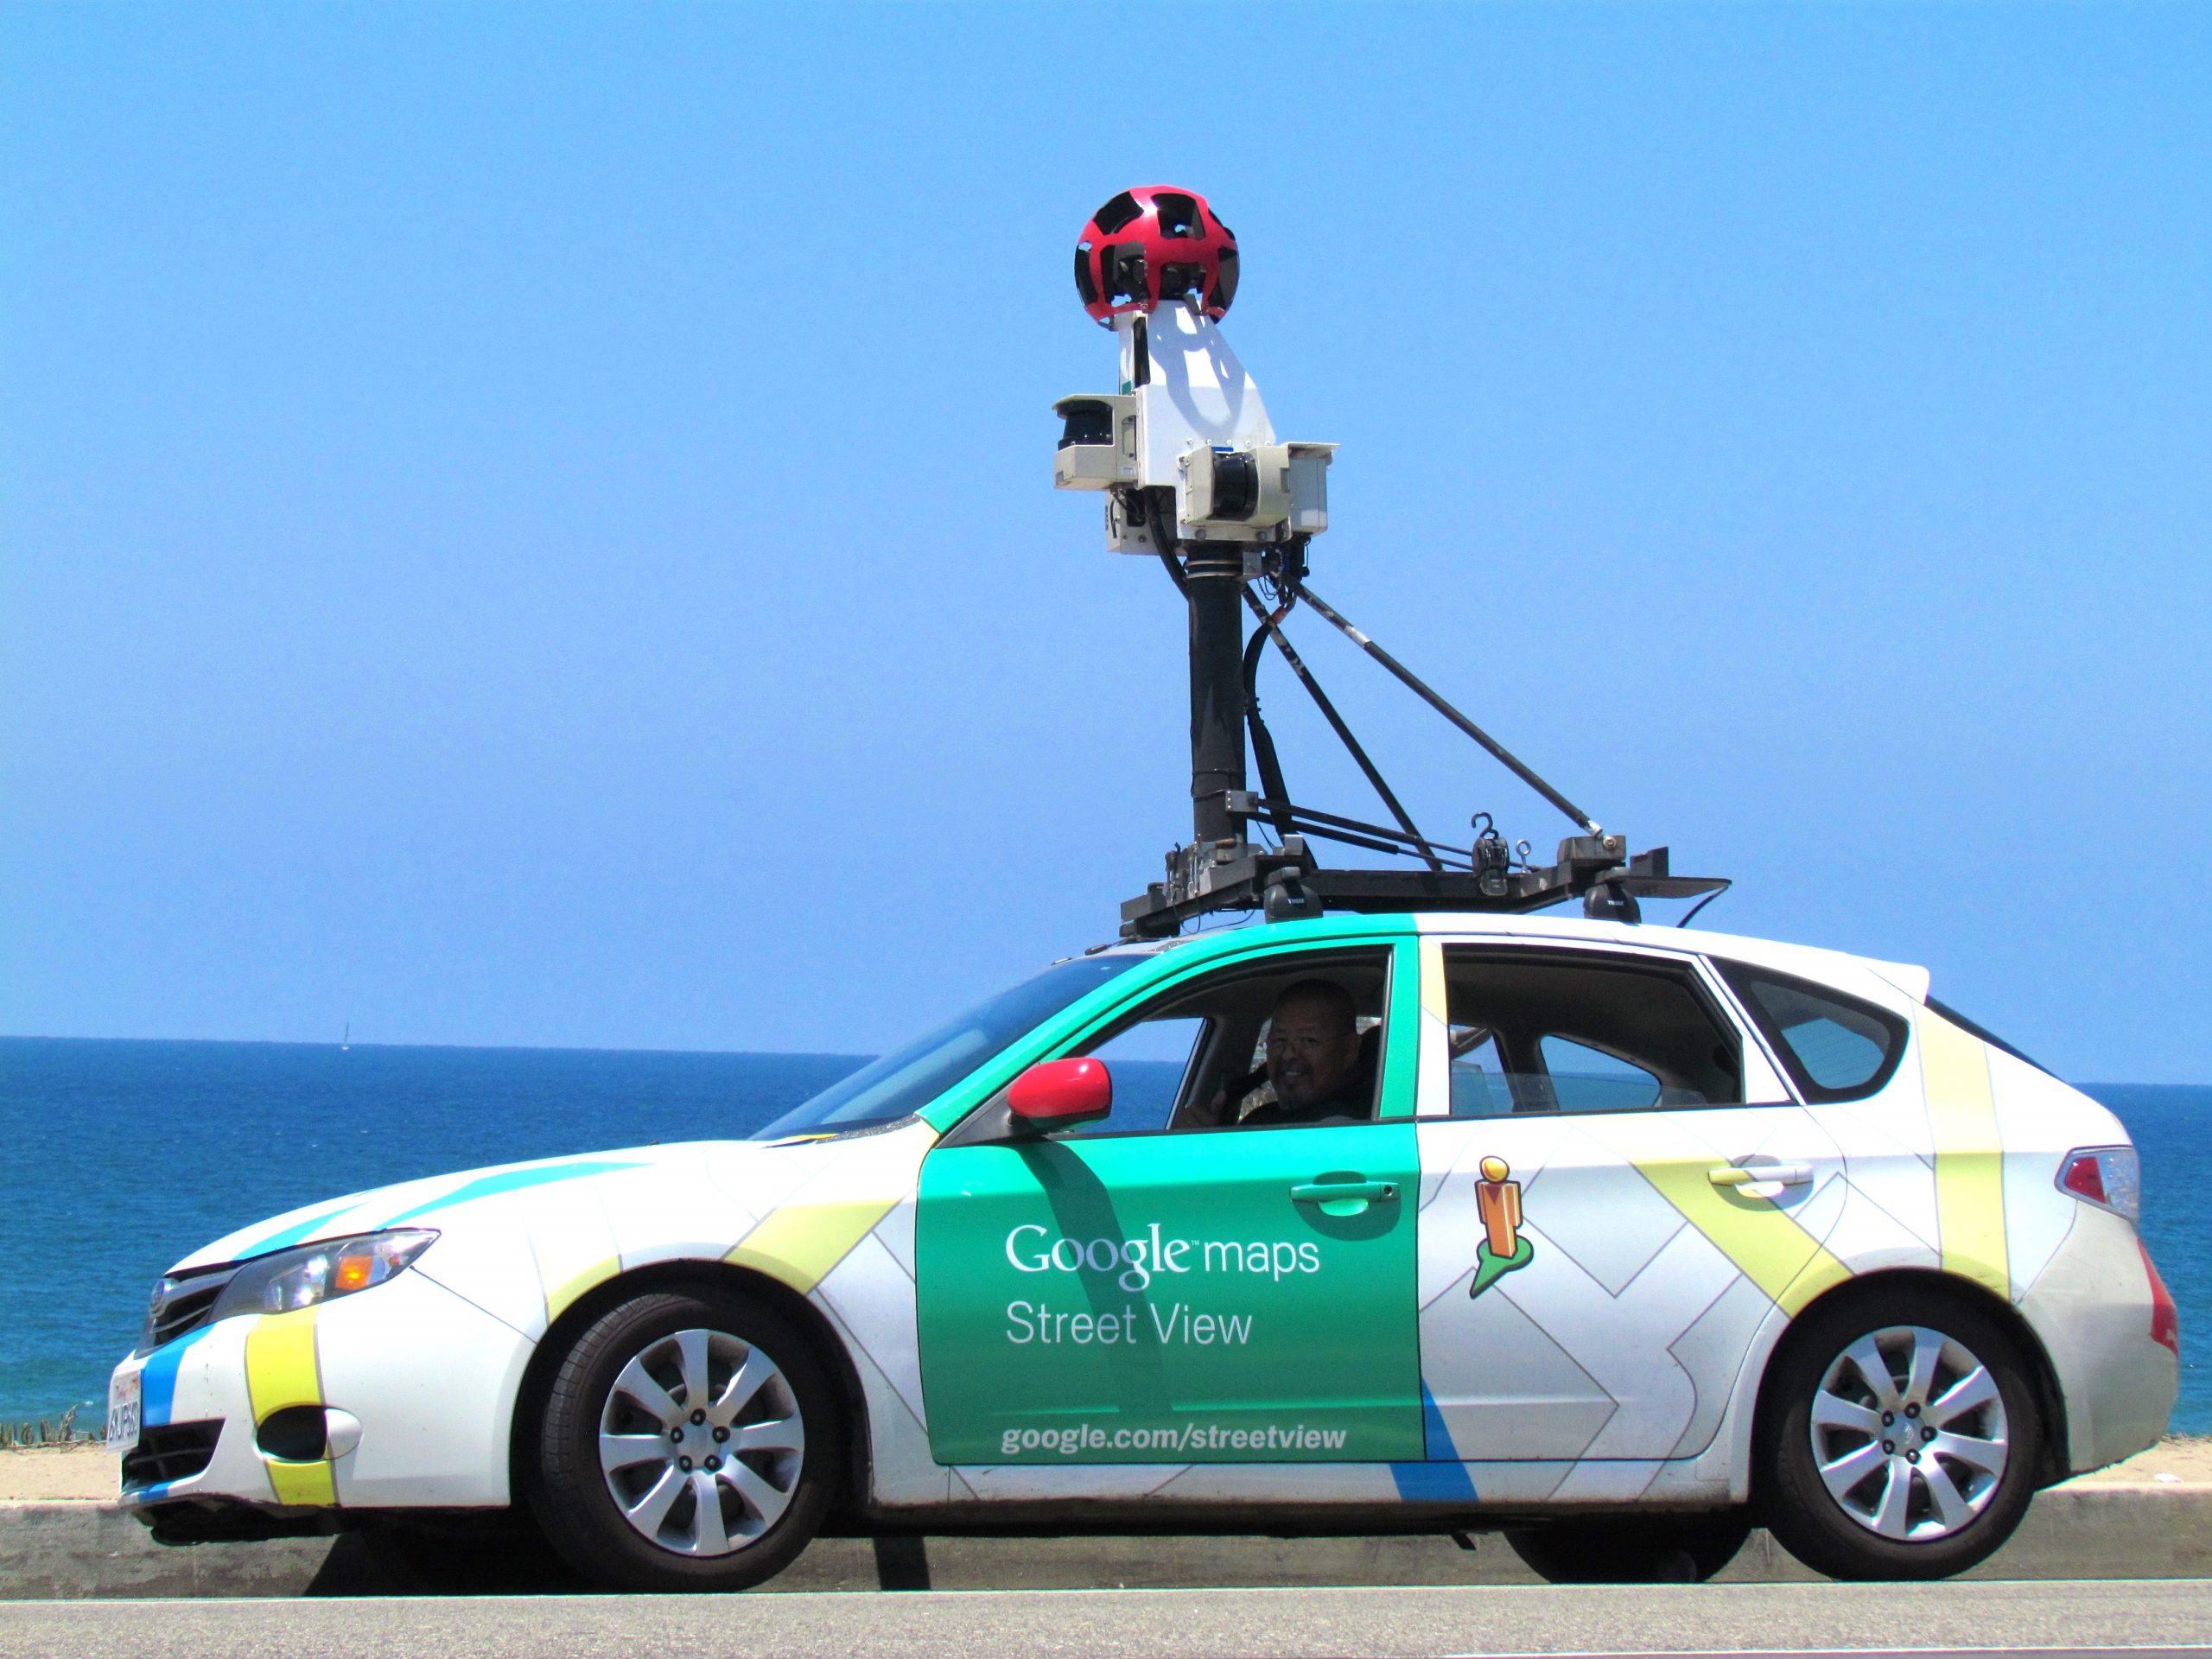
The acquisition of geographic knowledge is a lifelong endeavor. Though several factors influence the nature of such knowledge, we tend to rely on the three following types of geographic knowledge when navigating through space:
- Landmark knowledge refers to our ability to locate and identify unique points, patterns, or features (e.g., landmarks) in space.
- Route knowledge permits us to connect and travel between landmarks by moving through space.
- Survey knowledge enables us to understand where landmarks concern each other and to take shortcuts.
Each type of geographic knowledge is acquired in stages, one after the other. For instance, when we find ourselves in a new or unfamiliar location, we usually identify a few unique points of interest (e.g., hotel, building, fountain) to orient ourselves. We are building up our landmark knowledge. Using and traveling between these landmarks develops our route knowledge and reinforces our landmark knowledge and overall geographical awareness. Survey knowledge grows once we understand how routes connect landmarks and how various locations are situated in space. At this point, when we are comfortable with our survey knowledge, we can take shortcuts from one place to another. Though there is no guarantee that a shortcut will be successful, we are at least expanding our local geographic knowledge if we get lost.
Landmark, route, and survey knowledge are the cornerstones of having a sense of direction and framing our geographical learning and awareness. While some would argue that they are born with a good sense of direction, others admit getting lost. The popularity of personal navigation devices and online mapping services speaks to the overwhelming desire to know and situate where we are. Though developing and maintaining a keen sense of direction matters less and less as such devices and services continue to grow and spread, it can also be argued that the more we know about where we are in the world, the more we will want to learn about it.
This section covers concepts essential to geography, GIS, and other fields of interest. Understanding how location, direction, and distance can be defined and described provides a necessary foundation for the successful use and implementation of a GIS. Thinking about space and how we navigate through it also serves to improve our own geographic knowledge and spatial awareness.
Understanding Maps
A map can be defined as a graphic representation of the real world. Because of the infinite nature of our Universe, it is impossible to capture all of the complexity in the real world. For example, topographic maps abstract the three-dimensional real world on a two-dimensional paper plane at a reduced scale. Cartography is the study and practice of making maps. It combines science, aesthetics, and technique to create a balanced and readable representation of the world or a part of it on a flat surface. A cartographer is a person who makes maps or charts of different places or things. They can use scientific methods or computers to create maps.
Maps are among the most compelling forms of information for several reasons. Maps are artistic. Maps are scientific. Maps preserve history. Maps clarify. Maps reveal the invisible. Maps inform the future. Regardless of the reason, maps capture the imagination of people around the world. As one of the most trusted forms of information, map makers and geographic information system (GIS) practitioners hold considerable power and influence. Therefore, understanding and appreciating maps and how maps convey information are essential for GIS. The appreciation of maps begins with exploring various map types.
Most maps allow us to specify the location of points on the Earth’s surface using a coordinate system. This coordinate system can use geometric relationships between the perpendicular axes on a grid system for a two-dimensional map to define spatial location. Two types of coordinate systems are currently used in geography: the geographical coordinate system and the rectangular (Cartesian) coordinate system.
Geographic Information Science (GIScience)
Reference Maps
The primary purpose of a reference map is to deliver location information to the map user. Geographic features and map elements on a reference map tend to be treated and represented equally. In other words, no aspect of a reference map takes precedence over any other part. Moreover, reference maps illustrate geographic reality accurately. Standard reference maps include topographic maps such as those created by the United States Geological Survey (USGS) and image maps obtained from satellites or aircraft that are available through online mapping services.

The accuracy of a given reference map is indeed critical to many users. For instance, local governments need accurate reference maps for land use, zoning, and tax purposes. National governments need accurate reference maps for political, infrastructure, and military purposes. People who depend on navigation devices like global positioning systems (GPS) units also need accurate and up-to-date reference maps to reach their desired destinations.
Thematic Maps
Contrasting with the reference map are thematic maps. As the name suggests, thematic maps concern a particular theme or interest. While reference maps emphasize the location of geographic features, thematic maps are more concerned with how things are distributed across space. Such things are often abstract concepts such as life expectancy worldwide, per capita gross domestic product (GDP) in Europe, or literacy rates across India. One of the strengths of mapping, particularly thematic mapping, is that it can make such abstract and invisible concepts visible and comparable on a map.
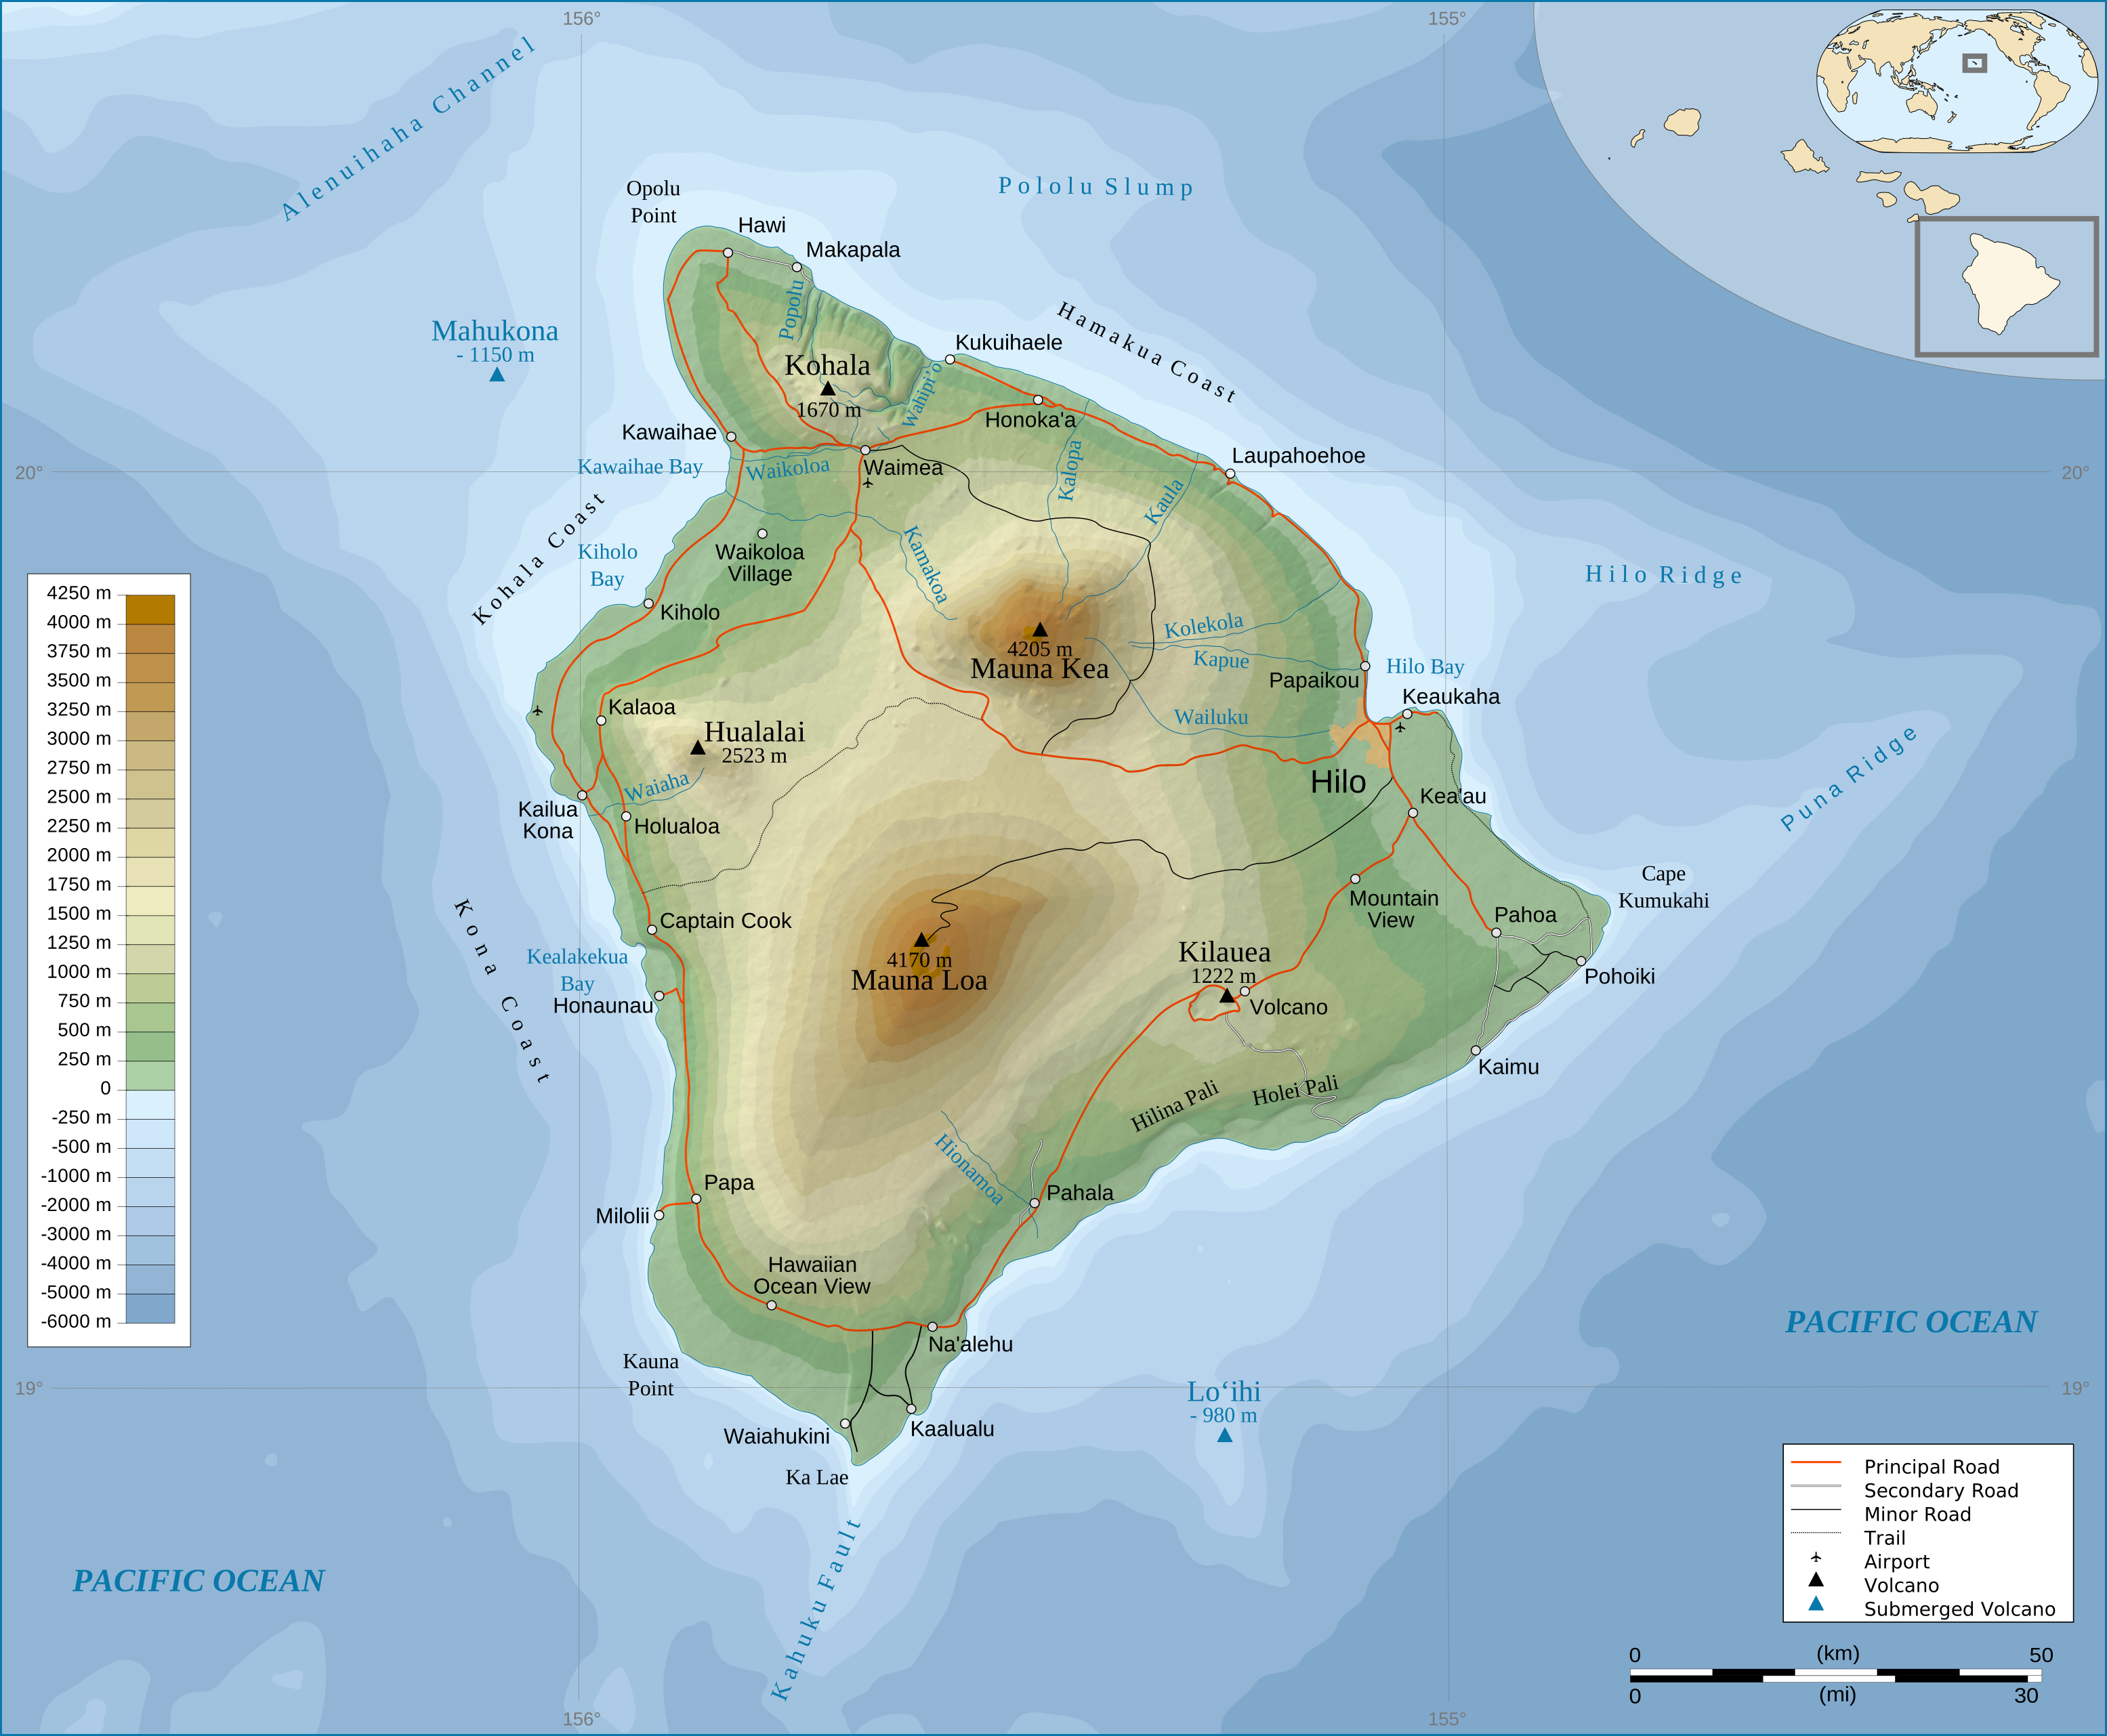

It is important to note that reference and thematic maps are not mutually exclusive. In other words, thematic maps often contain and combine geographical reference information, and conversely, reference maps may contain thematic details. Moreover, when used in conjunction, thematic and reference maps often complement each other.
For example, public health officials in a city may be interested in providing residents equal access to emergency rooms. Insights into this and related questions can be obtained through visual comparisons of a reference map showing emergency room locations across the city to thematic maps of various population segments (e.g., households below poverty, percent elderly, underrepresented groups).
Thematic maps are more abstract, involve more processing and interpretation of data, and often depict concepts that are not directly visible; examples include maps of income, health, climate, or ecological diversity. There is no clear-cut line between reference and thematic maps. Still, the categories are helpful to recognize because they relate directly to how the maps are intended to be used and to decisions that their cartographers have made in shrinking and abstracting aspects of the world to generate the map. Different types of thematic maps include:
- choropleth – a thematic map that uses tones or colors to represent spatial data as average values per unit area
- proportional symbol – uses symbols of different sizes to represent data associated with other regions or locations within the map
- isopleth– also known as contour maps or isopleth maps depict smooth continuous phenomena such as precipitation or elevation
- dot density – uses a dot symbol to show the presence of a feature or phenomenon – dot maps rely on a visual scatter to offer a spatial pattern
- dasymetric – an alternative to a choropleth map, but instead of mapping the data so that the region appears uniform, ancillary information is used to model the internal distribution of the data

Both reference and thematic maps are static or fixed representations of reality when presented in hardcopy format. Such permanence on the page suggests that geography and the things we map are also fixed or constant in many ways. This is far from the truth. Integrating GIS with other information technologies like the Internet and mobile telecommunications rapidly changes this view of maps, mapping, and geography.
Dynamic Maps
The diffusion of GIS and the popularity of online mapping tools and applications speak to this shift in thinking about maps and map use. In this regard, discussing the diffusion of dynamic maps is worthwhile. Dynamic maps are simply changeable or interactive representations of the Earth. Dynamic mapping refers more to how maps are used and delivered to the map user today (e.g., online, via mobile phone) than to the map’s content. Both reference and thematic maps can be dynamic and integral to any GIS. The critical point about dynamic maps is that more and more people, not just GIS professionals, have access to such maps.
Unlike a hardcopy map with features and elements users cannot modify or change, dynamic maps encourage and sometimes require user interaction. Such interaction can include changing the scale or visible area by zooming in or out, selecting which features or layers to include or remove from a map (e.g., roads, imagery), or even starting and stopping a map animation.
Just as dynamic maps will continue to evolve and require more user interaction in the future, map users will demand more interactive map features and controls. As this democratization of maps continues, map users’ geographic awareness and appreciation will also increase. Therefore, it is critical to understand maps’ nature, form, and content to support map users’ future needs, demands, and expectations.
Topographic Maps
Maps are used to display both the cultural and physical features of the environment. Standard topographic maps show various information, including roads, land-use classification, elevation, rivers and other water bodies, political boundaries, and the identification of houses and different types of buildings. Some maps are created with particular goals and an intended purpose.
Most maps allow us to specify the location of points on the Earth’s surface using a coordinate system. This coordinate system can use simple geometric relationships between the perpendicular axes on a grid system for a two-dimensional map to define spatial location. Two types of coordinate systems are currently used in geography: the geographical coordinate system and the rectangular (Cartesian) coordinate system.
Have you ever found driving directions and maps online, used a smartphone to ‘check in’ to your favorite restaurant, or entered a town name or zip code to retrieve the local weather forecast? Every time you and millions of other users perform these tasks, you use Geographic Information Science (GIScience) and related spatial technologies. Many of these technologies, such as Global Positioning Systems (GPS) and in-vehicle navigation units, are very well-known, and you can recall the last time you used them.
Geographic Information Science (GIScience)
Other applications and services that are the products of GIScience are a little less obvious, but they are every bit as standard. If you are connected to the Internet, you are using geospatial technologies. Every time your browser requests a web page from a Content Delivery Network (CDN), a geographic lookup occurs, and the server you are connected to contacts other servers closest to it and retrieves the information. This happens so that the delay between your request to view the data and the data sent to you is as short as possible.
GIScience and related technologies are everywhere, and we use them daily. When it comes to information, “spatial is special.” Reliance on spatial attributes separates geographic information from other types of information. There are several distinguishing properties of geographic information. Understanding them and their implications for the practice of geographic information science is critical to utilizing geographic data.
- Geographic data represent spatial locations and non-spatial attributes measured at certain times.
- Geographic space is continuous.
- Geographic space is nearly spherical.
- Geographic data tend to be spatially dependent.
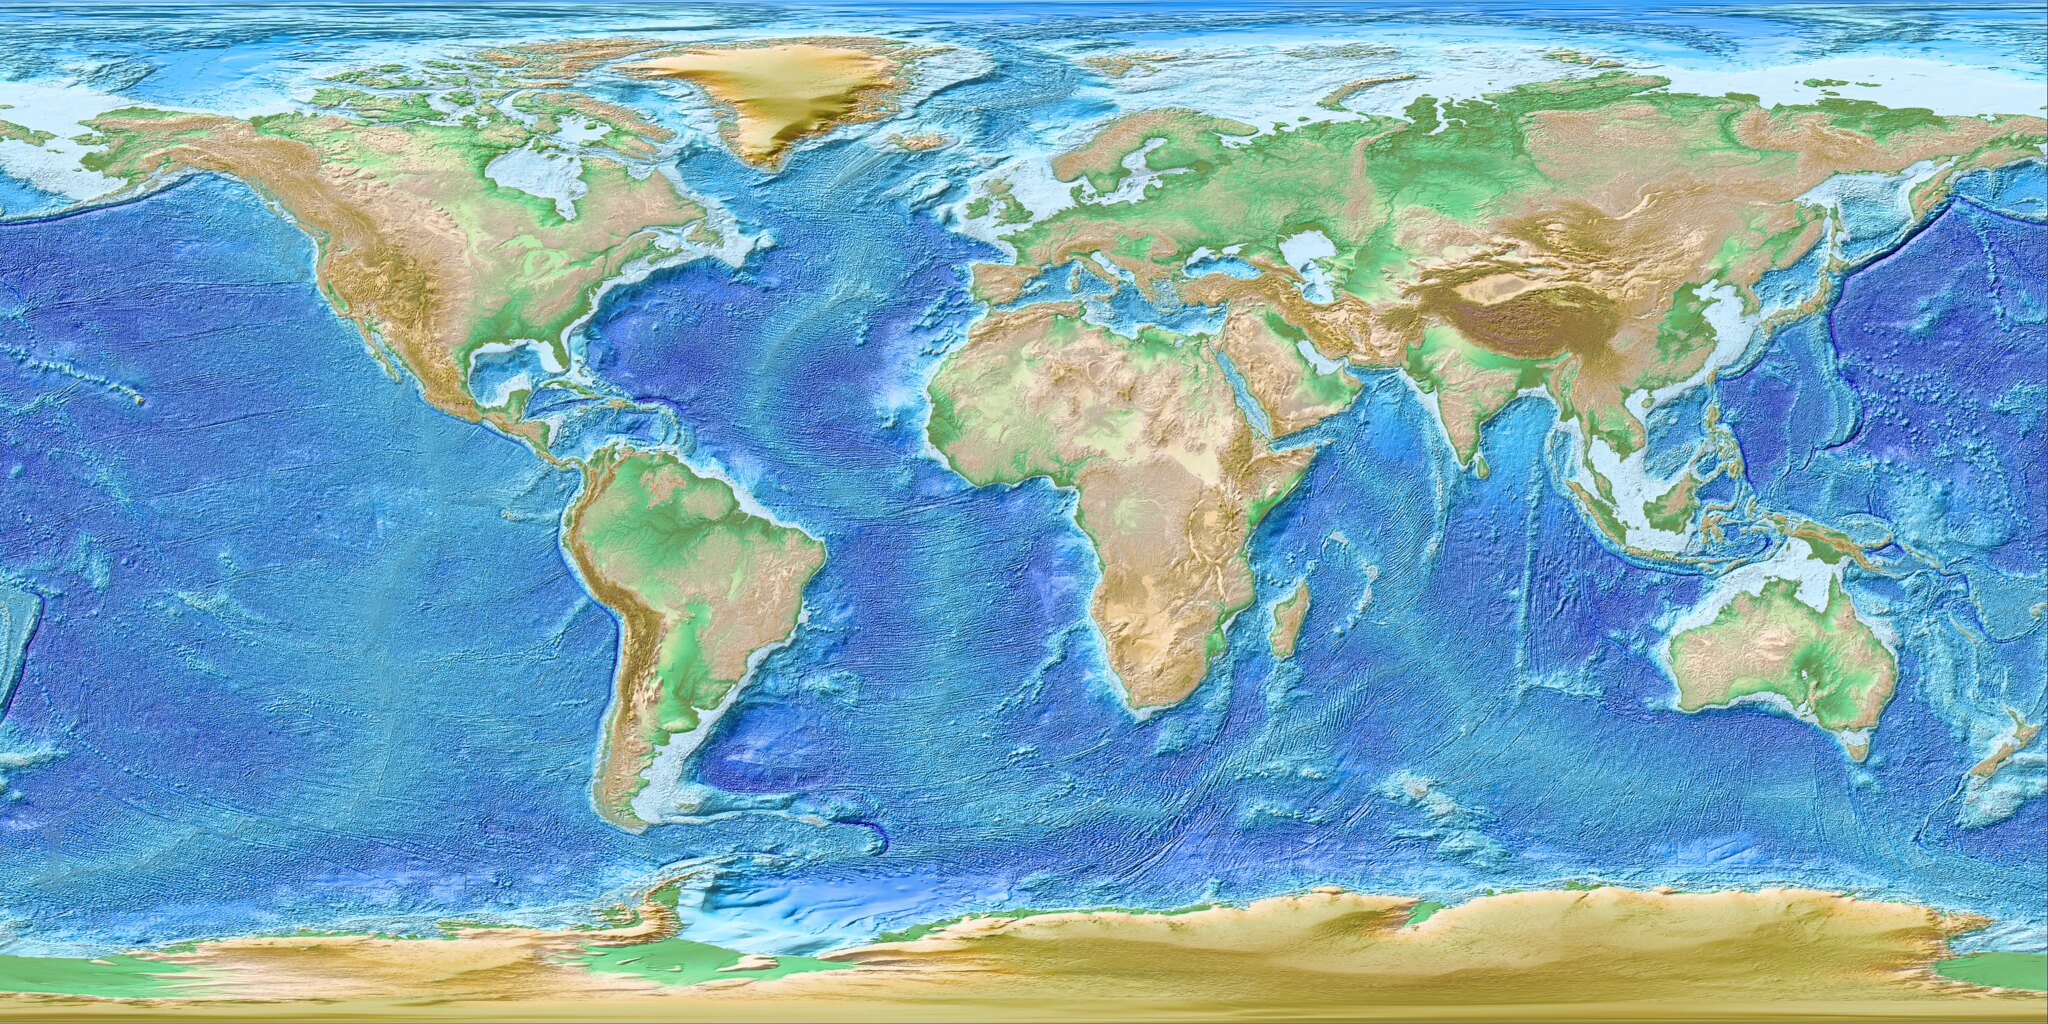
Spatial attributes tell us where or where things were when the data were collected. By merely including spatial details, geographic data allows us to ask many geographic questions. Another essential characteristic of geographic space is that it is “continuous.” Although the Earth has valleys, canyons, caves, oceans, and more, there are no places on Earth without a location, and connections exist from one place to another. Outside of science fiction, there are no tears in the fabric of space-time. Modern technology can measure location precisely, making it possible to generate incredibly detailed depictions of geographic feature locations (e.g., of the coastline of the eastern U.S.). It is often possible to measure so precisely that we collect more location data than we can store and much more than is useful for practical applications. How much information is helpful to store or display on a map will depend on the map scale (how much of the world we represent within a fixed display, such as the size of your computer screen) and on the map’s purpose. The map below is a digital elevation model (DEM), considered continuous because elevation always exists on the planet.
In addition to being continuous, geographic data tend to be spatially dependent. More simply, “everything is related to everything else, but near things are more related than distant things” (which leads to an expectation that things near one another tend to be more alike than far apart). How alike things are in their proximity to other items can be measured by a statistical calculation known as spatial autocorrelation. Without this fundamental property, geographic information science as we know it today would not be possible.
Geographic data come in many types from many different sources and are captured using many techniques; they are collected, sold, and distributed by a wide array of public and private entities. In general, we can divide the collection of geographic data into two main types:
- Directly collected data
- Remotely sensed data
Directly collected data are generated at the source of the phenomena being measured. Examples of directly collected data include temperature readings at specific weather stations, elevations recorded by visiting the location of interest, or the position of a grizzly bear equipped with a GPS-enabled collar. Also included here are data derived from surveys (e.g., the census) or observations (e.g., Audubon Christmas bird count).
Remotely sensed data are measured from remote distances without direct contact with the phenomena or the need to visit the locations of interest. Satellite images, sonar readings, and radar are all remotely sensed data.
Maps are the raw material and the product of geographic information systems (GIS). All maps represent features and characteristics of locations, and that representation depends upon data relevant at a particular time. All maps are selective; they do not show us everything about the place depicted; they only show the specific features and characteristics their maker decided to include. Maps are often categorized into reference or thematic maps based on the producer’s decision about what to have and the expectations about how the map will be used. The prototypical reference map depicts the location of “things” that are usually visible worldwide; examples include road maps and topographic maps showing terrain.