
Introduction to Geographic Science
1.5 Understanding Natural Disasters
Science of Natural Disasters
Because of the scientific method, we now understand where and why most natural disasters occur. For example, because of the theory of plate tectonics, we know why 90 percent of all earthquakes and volcanoes occur along the Pacific Ocean’s outer edges, called the Ring of Fire. The plate tectonics theory has also helped explain why some volcanoes are more explosive and active than others. We also understand that different tectonic plate boundaries produce different fault lines and, thus, several types of earthquakes.
Many natural hazards have seasons, especially those controlled by external forces. The United States has more tornadoes than the rest of the world combined, yet it occurs in the spring and early fall. Landslides are more prone in the spring when snow begins to melt, and the saturated ground causes unstable slopes to slide. Wildfires are frequent in the middle of the summer and early fall when the land is dry, and afternoon thunderstorms in arid climates produce lightning without any precipitation. Furthermore, hurricane season in the Northern Hemisphere peaks between August and September when the Atlantic Ocean is warmest.
Since hazards are statistically predictable in some manner, it becomes essential to develop a warning system. Predictions like weather predictions state that they will occur at a specified time, date, and intensity. It is like saying, “A major snowstorm will reach Salt Lake City at 4:30 PM for the commute home.” A forecast states a probability of something occurring, such as “40 percent of showers today.” Forecasts are much broader than predictions.
When a natural disaster event is about to happen or has occurred, a system has been set up to alert the public. A watch is issued when the conditions for an event are right. A tornado may form if a severe thunderstorm is strong enough and rotating. Alternatively, if an earthquake with a magnitude of 7.5 strikes somewhere in the ocean, a tsunami watch may be issued because it was strong enough to generate one. However, a watch does not necessarily mean that it will occur. A warning is sent to the areas that could be impacted if a tornado is spotted on the ground or an ocean sensor records an approaching tsunami.
Determining Risk
A risk assessment must be conducted for a specific geographic area to understand how to prepare for a natural hazard. The risk of a potential hazard is defined as the probability of a disaster multiplied by the consequence to the human environment.
- Risk = Probability of Disaster x Consequence of Disaster
It is essential to determine the potential risk a location has for any disaster to know how to prepare for one. Referring to Salt Lake City again, the probability of an earthquake occurring anytime soon is small, but the consequences to human lives and destruction are exceedingly high. There is a moderately increased risk of an earthquake striking Salt Lake City. One of the limiting factors of risk is knowing the probability of a disaster. Too often, scientific data lacks enough information to determine how a disaster usually occurs in a particular location. This is particularly true with geologic hazards, where geologic time is vastly more extensive than the age of scientific reasoning.
Hazards, Disasters, and Catastrophes
What is the difference between natural hazards, disasters, or catastrophes? A hazard is any natural process or event directly threatening the human environment. The event itself is not a hazard; a function or event becomes a hazard when it threatens human interests. A disaster is the effect of a hazard on society, usually an event that occurs over a limited time in a defined geographic area. The term disaster is used when the interaction between humans and a natural process results in significant property damage, injuries, or loss of life. Finally, a catastrophe is a massive disaster that significantly impacts the human environment and requires considerable time, money, and resources for response and recovery.
Click on the story map below, titled US Hazards, to spatially understand the variety of natural hazards across the United States and their potential impact on society.
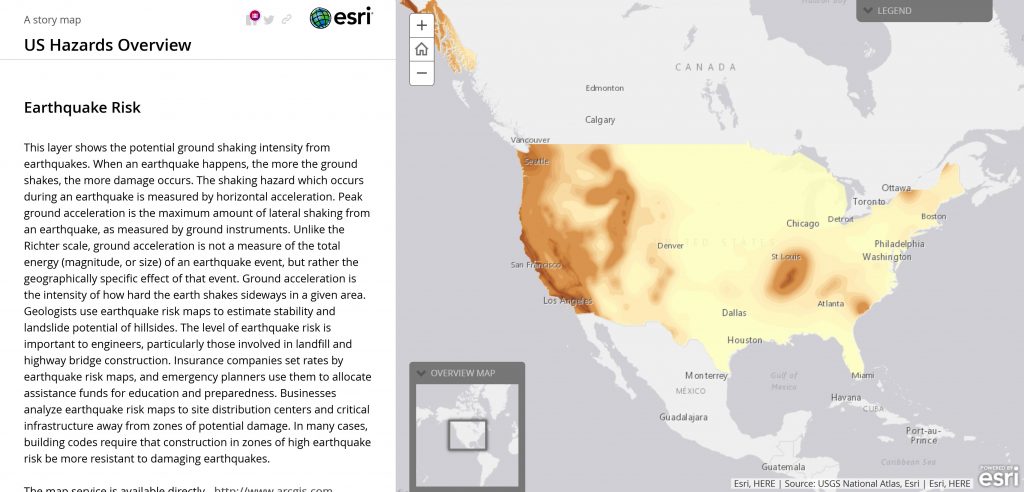
Currently, the earthquake that is expected to strike Salt Lake City is just a hazard, a natural process that poses a potential threat to the human environment because it has not occurred yet. If that earthquake turns out to be a moderate 5.0 magnitude earthquake, it will be considered a disaster. However, if the expected 7.0 to 7.5 magnitude earthquake were to occur, it would be viewed as a catastrophe because thousands of people would perish, tens of thousands would be injured, and the economic cost would be billions of dollars. An article by NASA titled The Rising Costs of Natural Hazards talks about how the financial and human cost of natural disasters is rising. Better mitigation efforts will be required to help prepare for these disasters, such as proper building and zoning codes, first responder preparedness, and public education.
In the summer of 2008, China was rocked by a magnitude 8.0 earthquake that killed over 80,000 people. A week earlier, a cyclone struck Burma, killing 130,000. On January 12, 2010, a magnitude 7.0 earthquake killed nearly 300,000 people and leveled the capital city of Port-a-Prince in Haiti. On March 11, 2011, a magnitude 9.0 earthquake generated a tsunami off the coast of eastern Japan, killing 30,000 people. Are natural disasters getting worse? Not really. Humans are overpopulating the Earth and living in more hazard-prone areas. Over the last 70 years, the world’s population has tripled to 6.7 billion. World population projections suggest that the human population will reach 9 billion by 2050. exponentially grow, and 2050 the world’s population will reach 9 billion. Exponential growth means the world’s population will not grow linearly (in a straight line) but rather as a percentage. Our increased population has caused air quality to suffer, reduced the availability of clean drinking water, raised the world’s extreme poverty rate, and made us more prone to natural hazards.
There is also a relationship between the magnitude of an event (energy released) and its frequency (intervals between episodes). The more earthquakes that occur in a particular location, the weaker they tend to be. That is because built-up energy is slowly being released constantly. However, if there are long intervals between one earthquake and the next, the energy can build and produce a stronger earthquake. That is the problem with earthquakes along the Wasatch Front of Utah. The interval or frequency between earthquakes tends to be 1,500 years, so the magnitude tends to be high because of the built-up energy. We will want to get this earthquake over with at some point because the longer it waits, the worse it will be.
Primary and Secondary Effects
Natural disasters cause two types of effects: direct and indirect. Direct effects, also called primary effects, include destroyed infrastructure and buildings, injuries, separated families, and even death. Indirect, called secondary effects, are things like contaminated water, disease, and financial losses. In other words, indirect effects are things that happen after the disaster has occurred.
How we build our cities will significantly determine how many lives are saved in a disaster. For example, we should not be building homes in areas that are prone to landslides, liquefaction, or flash floods. Instead, these places should be left as open spaces such as parks, golf courses, or nature preserves. This is a matter of proper zoning laws, which the local government controls. Another way we can reduce the impact of natural disasters is by having evacuation routes, disaster preparedness and education, and building codes so that our buildings do not collapse on people.
Internal and External Forces
Two forces generate natural hazards: internal forces and external forces. The first is internal forces generated by the Earth’s internal heat, creating geologic hazards like earthquakes, volcanoes, and tsunamis. The theory of plate tectonics proposes that internal heating from the Earth’s core causes large tectonic plates that make up the planet’s continents and oceans to move around like bumper cars, where they either slam into each other or pull apart.
External forces influence weather, climate, and landslides. Heating from the Sun causes differential heating on the surface, creating our weather and all its associated hazards. These external forces generate flash floods, tornadoes, hurricanes, supercells, and climatic disasters such as droughts and famines.
Human Population
Sometimes, people will ask if natural disasters are getting worse. This apocalyptic concern has only increased because of climate change or COVID-19. From a geologic perspective, the data suggests that natural events are not continuing to get worse. That does not mean that issues such as climate change should be discounted, far from it. But one consistent variable is that human population growth is causing humans to be more in the way of natural events.
Demography is the study of how human populations change over time and space. It is a branch of human geography related to population geography, which examines the spatial distribution of human populations. Geographers study how populations grow and migrate, how people are distributed worldwide, and how these distributions change over time.
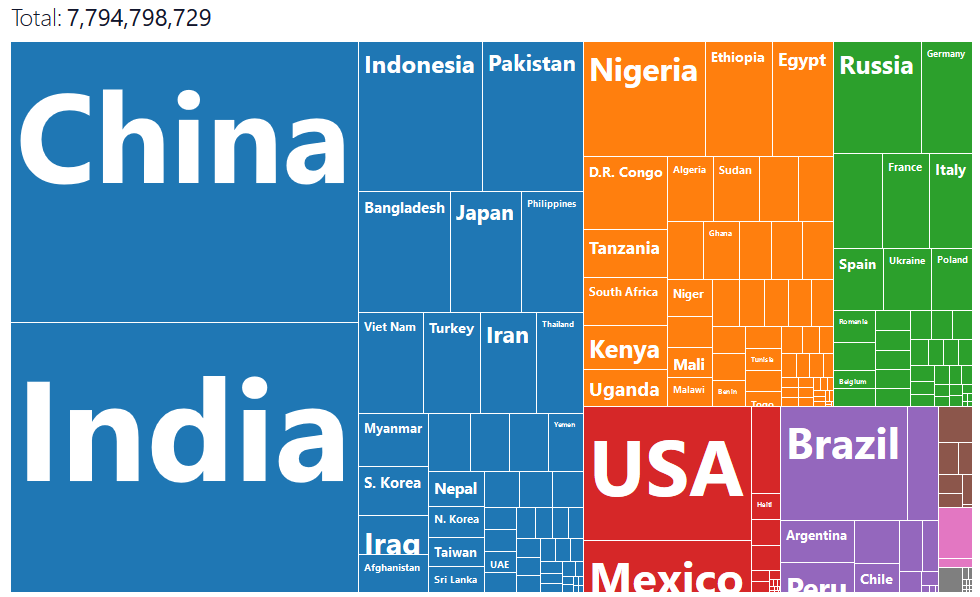
For most of human history, few people lived on Earth, and the world population grew slowly. Only about five hundred million people lived on the entire planet in 1650 (less than half of India’s population in 2000). Things changed dramatically during Europe’s Industrial Revolution in the late 1700s and 1800s, when declining death rates due to improved nutrition and sanitation allowed more people to survive to adulthood and reproduce. The population of Europe increased. However, by the middle of the twentieth century, birth rates in developed countries declined, as children had become a financial liability rather than an economic asset to families. Fewer families worked in agriculture, more families lived in urban areas, and women delayed the age of marriage to pursue education, resulting in a decline in family size and a slowing of population growth. The population is declining in some countries (e.g., Russia and Japan), and the average age in developed countries has been rising for decades. The process just described is called the demographic transition.
At the beginning of the twentieth century, the world’s population was about 1.6 billion. One hundred years later, there were roughly six billion people worldwide, and as of 2011, the number was approaching seven billion. This rapid growth occurred as the demographic transition spread from developed countries to the rest of the world. During the twentieth century, death rates due to disease and malnutrition decreased in every corner of the globe. In developing countries with agricultural societies, however, birth rates remained high. Low death rates and high birth rates resulted in rapid population growth.
Meanwhile, birth rates and family sizes have declined in most developing countries as people leave agricultural professions and move to urban areas. This means that population growth rates, while still higher in the developing world than in the developed world, are declining. Although the exact figures are unknown, demographers expect the world’s population to stabilize by 2100 and decline.
The world’s population growth rate has primarily occurred in developing countries, whereas populations are stable or declining in Europe and North America. The world’s population increase is pronounced on the continent of Asia: China and India are the most populous countries, each with more than a billion people, and Pakistan is an emerging population giant with a high population growth rate. The continent of Africa has the highest fertility rates in the world. The most striking paradox within population studies is that while there has been a decline in fertility (a declining family size) in developing countries, the world’s population will grow by 2030 because of the compounding effect of many people already in the world. Even though population growth rates are in decline in many countries, the population is still growing. A small growth rate on a broad base population still results in the birth of many millions of people.
As of May 2020, the United States Census Bureau estimates the world population is nearly 7.65 billion, with a growth rate of roughly 1.07 percent, or approximately 82 million people annually. The world population reached 6 billion in 1999 and 7 billion in 2011. If the current growth rate continues, the human population will reach 8 billion by 2023 and hopefully level off at roughly 10 billion by 2055. Between 2010 and 2050, world population growth will be generated exclusively in developing countries.
The world’s three most significant population clusters are the regions of eastern China, South Asia, and Europe. Southeast Asia also has large population clusters. Additionally, large population centers exist in various countries with high urbanization. An example is the urbanized region between Boston and Washington, DC, including New York City, Philadelphia, Baltimore, and neighboring metropolitan areas, often called megalopolis. The coastal country of Nigeria in West Africa and the island of Java in Indonesia are good examples of large population clusters centered in the tropics.
Social dynamics and geography will determine where the new additions to the human family will live. Providing food, energy, and materials for these additional humans will tax many countries, and poverty, malnutrition, and disease are expected to increase in regions with poor sanitation, limited clean water, and a lack of economic resources. In 2010, more than two billion people (one-third of the planet’s population) lived in abject poverty and earned less than the equivalent of two US dollars per day. The carrying capacity of the world is not and cannot be known. How many humans can the Earth sustain indefinitely? There is the possibility that we have already reached the threshold of its carrying capacity.
The human population will continue to grow until it either crashes due to the depletion of resources or stabilizes at a sustainable carrying capacity. Population growth takes a toll on the Earth as more people use more environmental resources. The areas most immediately affected by increased populations include forests (a fuel resource and a source of building material), freshwater supplies, and agricultural soils. These systems get overtaxed, and their depletion has profound consequences. Type C climates, which are moderate and temperate, are usually the most productive and are already vulnerable to severe deforestation, water pollution, and soil erosion. Maintaining adequate food supplies will be critical to supporting a sustainable carrying capacity. The ability to transport food supplies quickly and safely is a significant component of managing the conservation of resources. Deforestation by humans using wood for cooking fuel is already a severe concern in arid type B climates.
Population Demographics
The Industrial Revolution, which prompted the shift in population from rural to urban, also encouraged market economies, which have evolved into modern consumer societies. Various theories and models have been developed to help explain these changes. For example, in 1929, the American demographer Warren Thompson developed the Demographic Transition Model (DTM) to explain population growth based on an interpretation of demographic history. A revised version of Thomson’s model outlines five stages of the demographic transition from traditional rural to modern urban societies.

Stage 1: Low Growth Rate
Humans have lived in the first stage of the DTM for most of our existence. In this first stage, CBRs and CDRs fluctuated regionally, globally, and over time because of living conditions, food output, environmental conditions, war, and disease. The natural increase of the world was stable because CBRs and CDRs were about equal. However, around 8,000 BC, the world’s population grew dramatically due to the agricultural revolution. During this time, humans learned to domesticate plants and animals for personal use and became less reliant on hunting and gathering for sustenance. This allowed for more stable food production and allowed village populations to grow. War and disease prevented population growth from occurring on a global scale.
Stage 2: High Growth Rate
Around the mid-1700s, global populations grew ten times faster than in the past because of the Industrial Revolution. The Industrial Revolution brought with it a variety of technological improvements in agricultural production and food supply. Increased wealth in Europe and later North America because the Industrial Revolution meant more money and resources could be devoted to medicine, medical technology, water sanitation, and personal hygiene. Sewer systems were installed in cities; thus, public health improved. All this dramatically caused CDRs to drop around the world. At first, CBRs stayed high as CDRs dropped, causing populations to increase in Europe and North America. Over time, this would change.
Africa, Asia, and Latin America moved into Stage 2 of the demographic transition model two hundred years later for more varied reasons than those of their European and North American counterparts. The medicine created in Europe and North America was brought into these developing nations, creating what is now called the medical revolution. This revolution or diffusion of medicine to this region caused death rates to drop quickly. While the medical revolution reduced death rates, it did not bring with it the wealth and improved living conditions and development that the Industrial Revolution created. Global population growth is most significant in the regions still in Stage 2.
Stage 3: Moderate Growth Rate
Europe and North America have moved to Stage 3 of the demographic transition model. A nation moves from Stage 2 to Stage 3 when CBRs begin to drop while CDRs remain low or even continue to fall. It should be noted that the natural rate of increase in nations within Stage 3 is moderate because CBRs are higher than CDRs. The United States, Canada, and European nations entered this stage in the early 20th century. Latin American nations entered this stage later in the century.
Advances in technology and medicine cause a decrease in IMR and overall CDR during Stage 2. Social and economic changes bring about a decrease in CBR during Stage 3. Countries that begin to acquire wealth tend to have fewer children as they move away from rural-based development structures toward urban-based structures because more children survive in childhood. The need for large families for agricultural work decreases. Additionally, women gained more legal rights and chose to enter the workforce, own property, and have fewer children as nations moved into Stage 3.
Stage 4: Return to Low Growth Rate
A country enters Stage 4 of the demographic transition model when CBRs are equal to or become less than CDRs. When CBRs are equal to CDRs, a nation will experience zero population growth (ZPG). This occurs in many countries where girls do not live as long as they reach their childbearing age due to gender inequality.
A country in the first two stages of the transition model will have a broad base of young people and a smaller proportion of older people. A country in Stage 4 will have a much smaller base of young people (fewer children) but a much larger population of elderly (decreased CDR). A country with a large youth population is more likely to be rural, with high birthrates and death rates, helping geographers analyze a nation’s health care system. Moreover, a country in Stage 4 with a large elderly population will have fewer young people supporting the economy. These two examples represent the dependency ratio mentioned earlier in this chapter. This ratio is the number of young and older adults dependent on the working force.
Human geographers like to focus on the following demographic groups: 0-14 years old, 15-64 years old, and 65 and older. Individuals 0-14 and over sixty-five are considered dependents (though this is changing in older generations). One-third of all young people live in developing nations. Moreover, this places considerable strain on those nations’ infrastructure, such as schools, hospitals, and daycare. Older individuals in more developed countries (MDL) benefit from health care services but require more help and resources from the government and the economy.
Another ratio geographers look at is the number of males compared to females, called the sex ratio. Globally, more males are born than females, but males have a higher death rate than females. However, understanding a country’s sex and dependency ratios helps human geographers analyze fertility rates and natural increases.
As noted earlier, population growth has increased dramatically in the last century. No country is still in Stage 1; very few have moved into Stage 4. Most of the world is either in Stage 2 or 3, which both have higher CBRs than CDRs, creating a human population of over 7.5 billion today.
Stage 5: Population Decline
Many demographers believe a new stage in the DTM should be added to address issues starting to develop in countries within Europe and Japan. CBR would be extremely low, and CDR would increase in this final stage. This would cause the area’s NIR to be negative, leading to declining population growth. This may strain a country’s social safety net programs as it tries to support older citizens who are no longer working and contributing to the economy.
Unnatural Disasters
Former UN Security General Kofi Annan has said, “The term natural disaster has become an increasingly misnomer. Human behavior transforms natural hazards into unnatural disasters.” Most deaths from natural disasters occur in less developed countries. According to the United Nations, a less developed country (LDC) is a country that exhibits the lowest indicators of socioeconomic development and is ranked among the lowest on the Human Development Index. Those who live in low-income environments tend to have the following characteristics:
- Live in areas at a higher risk of geologic, weather, and climate-related disasters.
- They live in areas that lack the economics and resources to provide a safe living infrastructure for their people.
- Tend to have few social and economic assets and a weak social safety net
- Lack of the technological infrastructure to provide early warning systems
As human populations have grown and expanded, and technology has allowed us to manipulate the environment, natural disasters have become more complex and “unnatural.” Humans have not only influenced but magnified the impacts of disasters on society in numerous ways. For simplification, this book will narrow it down to four: human population growth, poverty and inequality, environmental degradation, and climate change.