5 Writing the Results Section
5.1 The Results Section
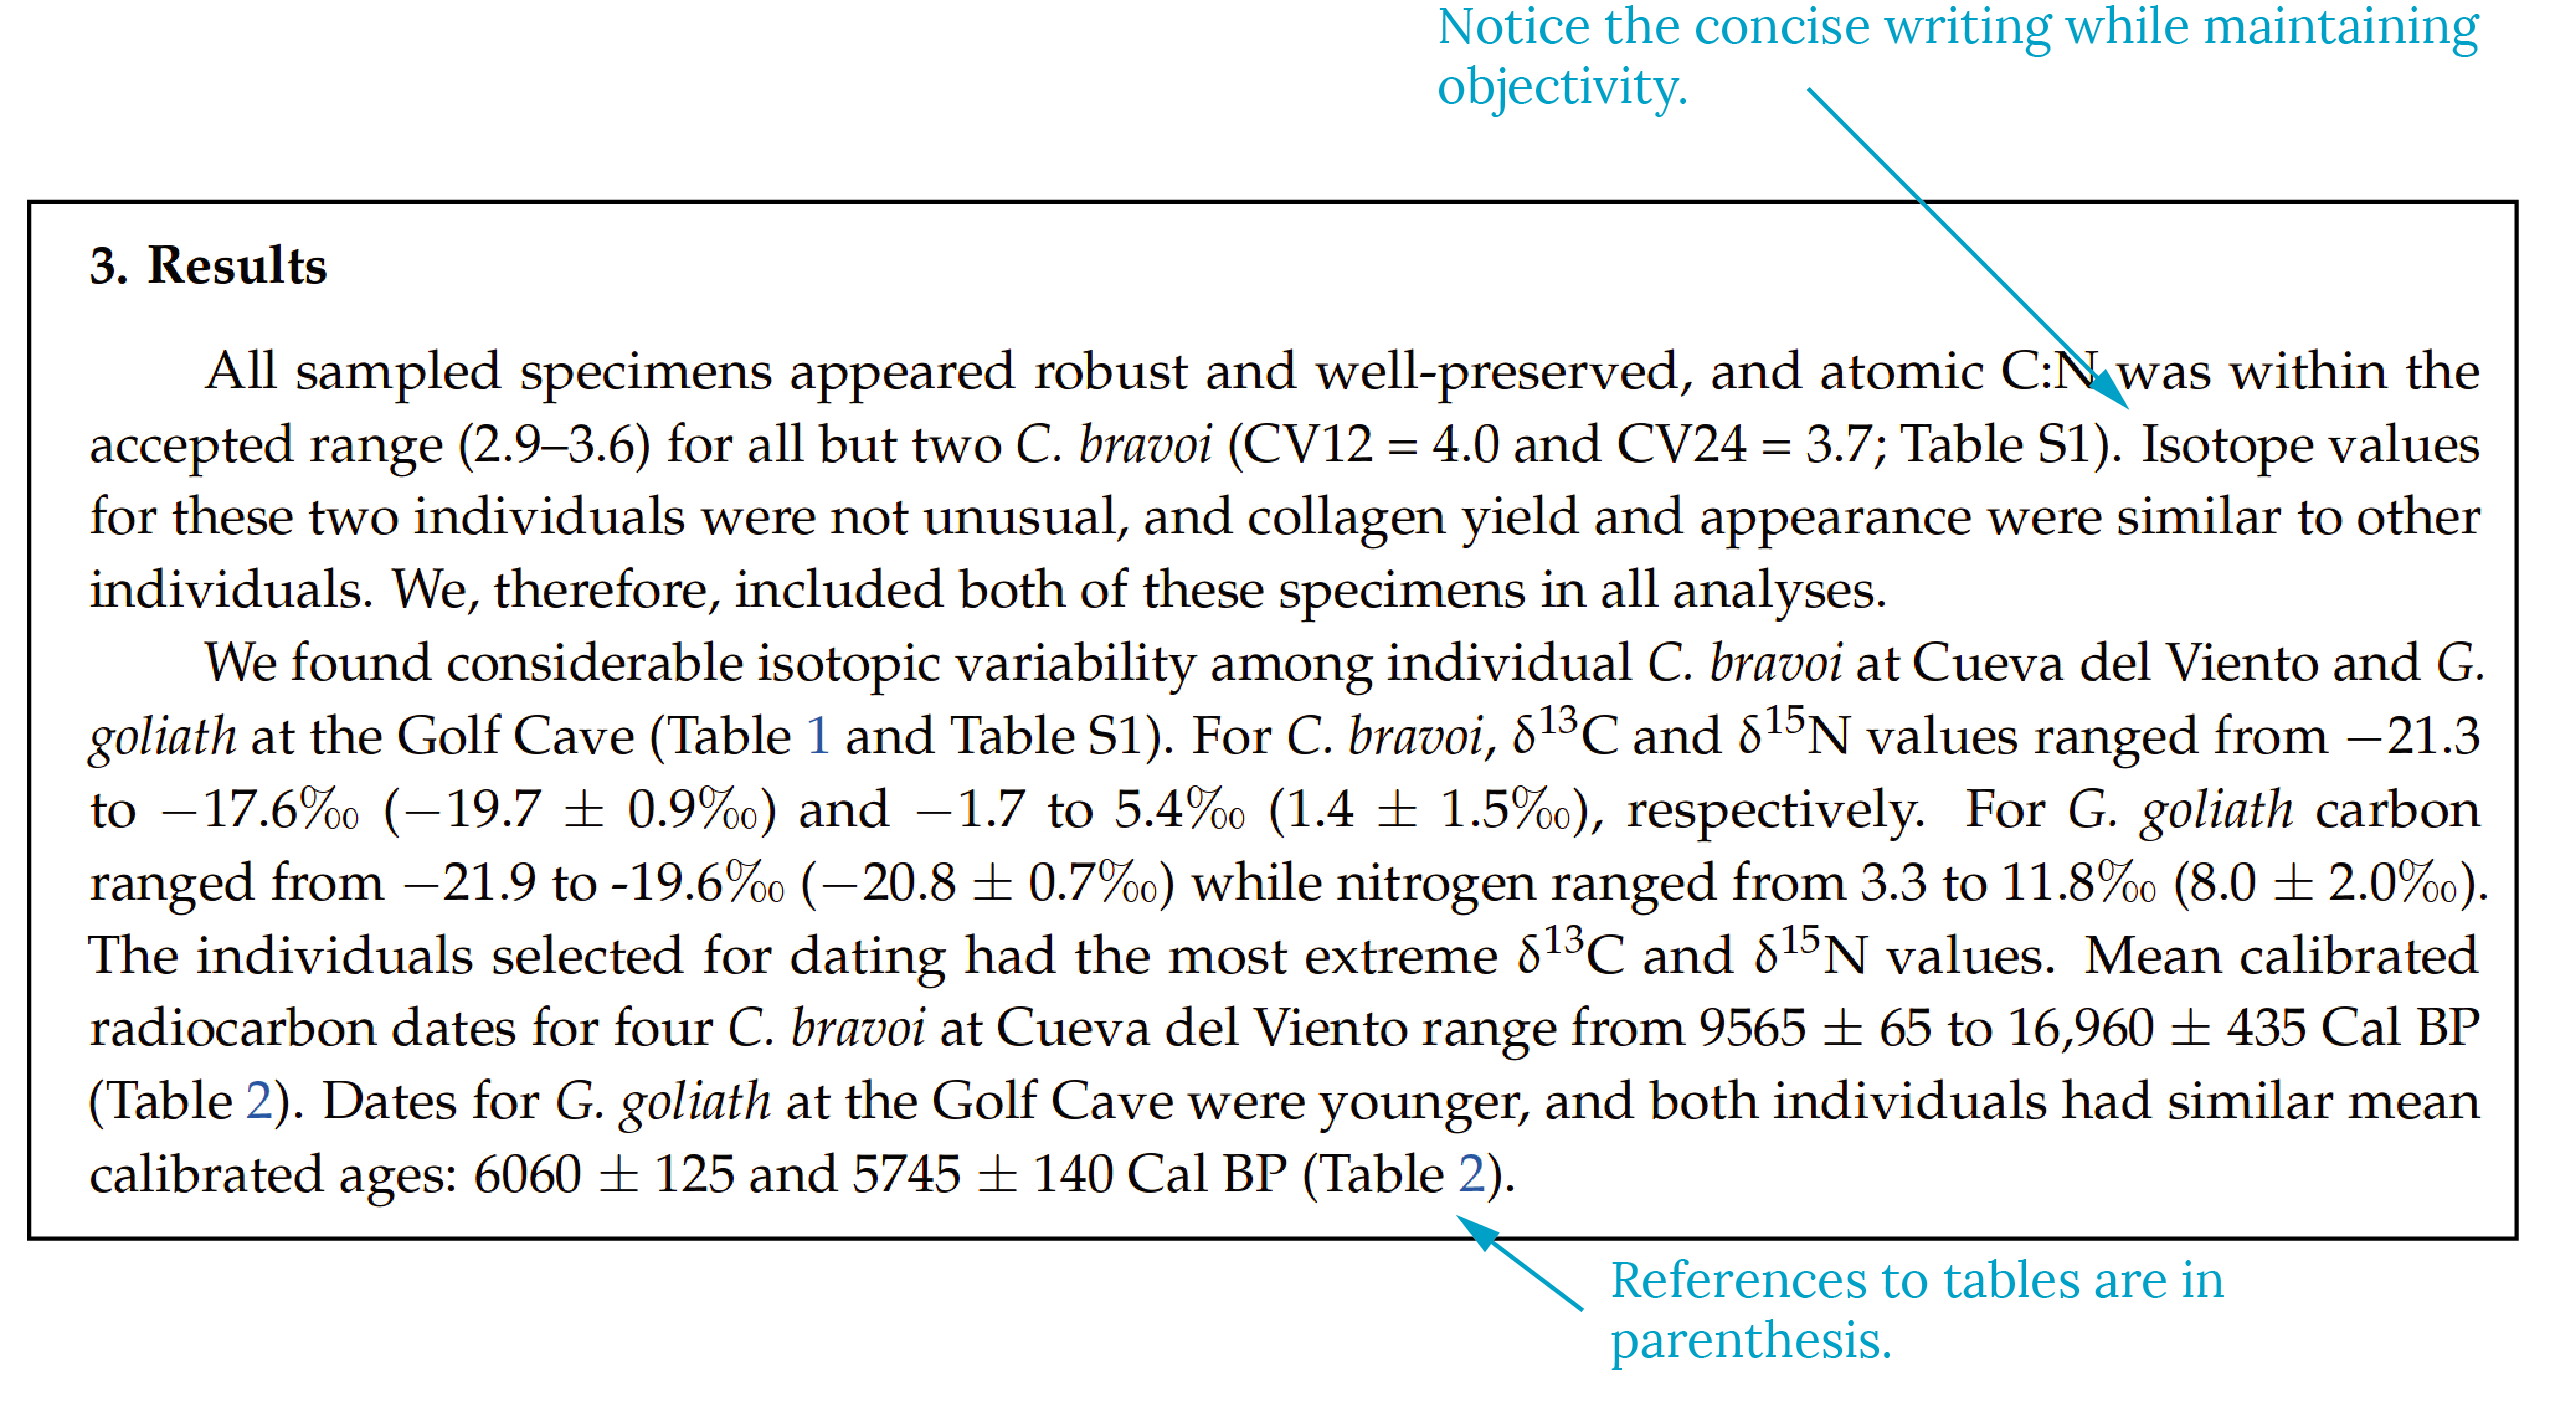
This section explains what you found; i.e., the answer to your research question. The Results and the Discussion (of the results) sections are the two most often mixed up sections by those who are new to this structure of writing. Just remember that Results is where you objectively summarize and present the data.
Generally, this section will begin with a brief overview of the results, then cover each of the main results from the data. Objectively point out the main ideas and use tables, figures, and other graphics as necessary to present the data. This section also discusses any limitations of the study. Fig. 2.6 shows an example of the Results section.
Writing tips:
If you are writing a purely research paper you can present your findings using verbs of attribution: words that point out that these are someone else’s ideas. For example, you could write:
- The author stated
- This article points out
- We found
- The results of the PCR analysis showed that
- Model results can be seen in Table X
Just remember not to interpret the information. For writing an experimental report here are some tips:
Do:
- Report results and show supporting data
- Order results from most to least complex
- Describe results in past tense
- Be concise: Examining patterns for 38,646 measurements of foliar δ15N from non-N2-fixing species, mean foliar δ15N was 0.4‰ (Table 1).
Don’t:
- Interpret results
- Repeat all the data from the table, instead select important results to report
- Be verbose: Table 1 indicates that after examining patterns for 38,646 measurements of foliar δ15N from non-N2-fixing species the mean foliar δ15N was 0.4‰.
5.2 Figures and Tables
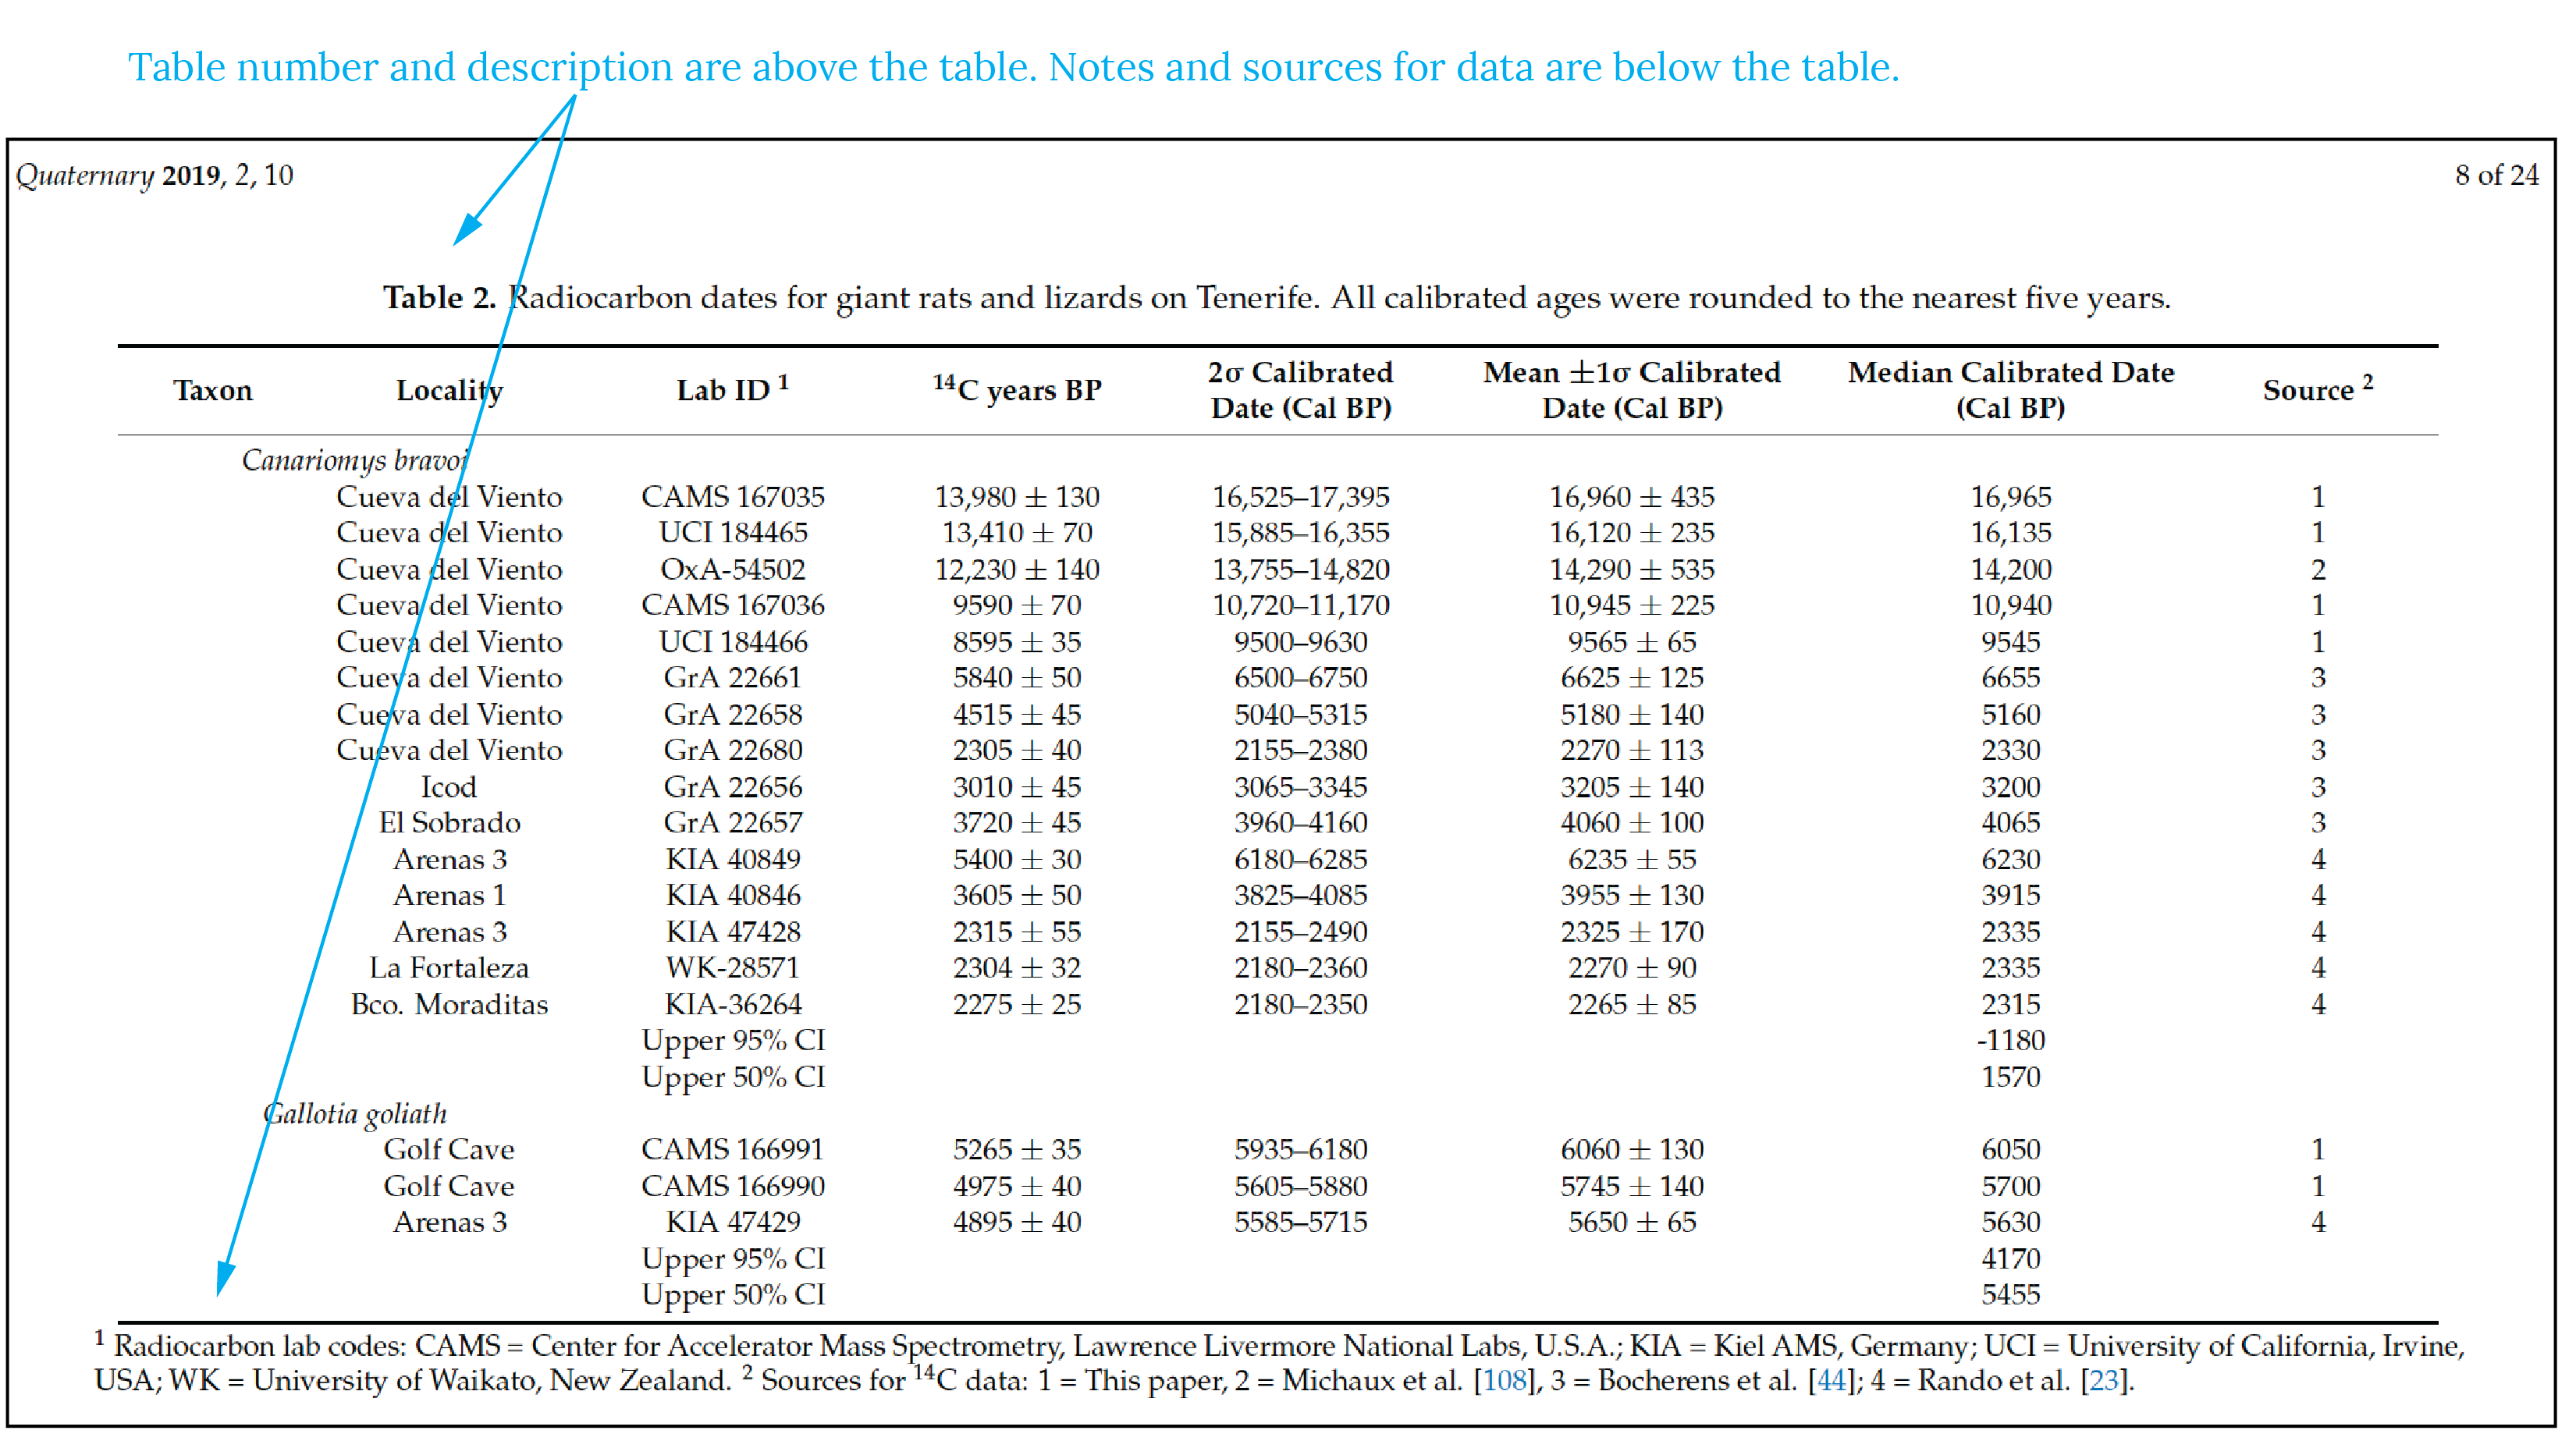
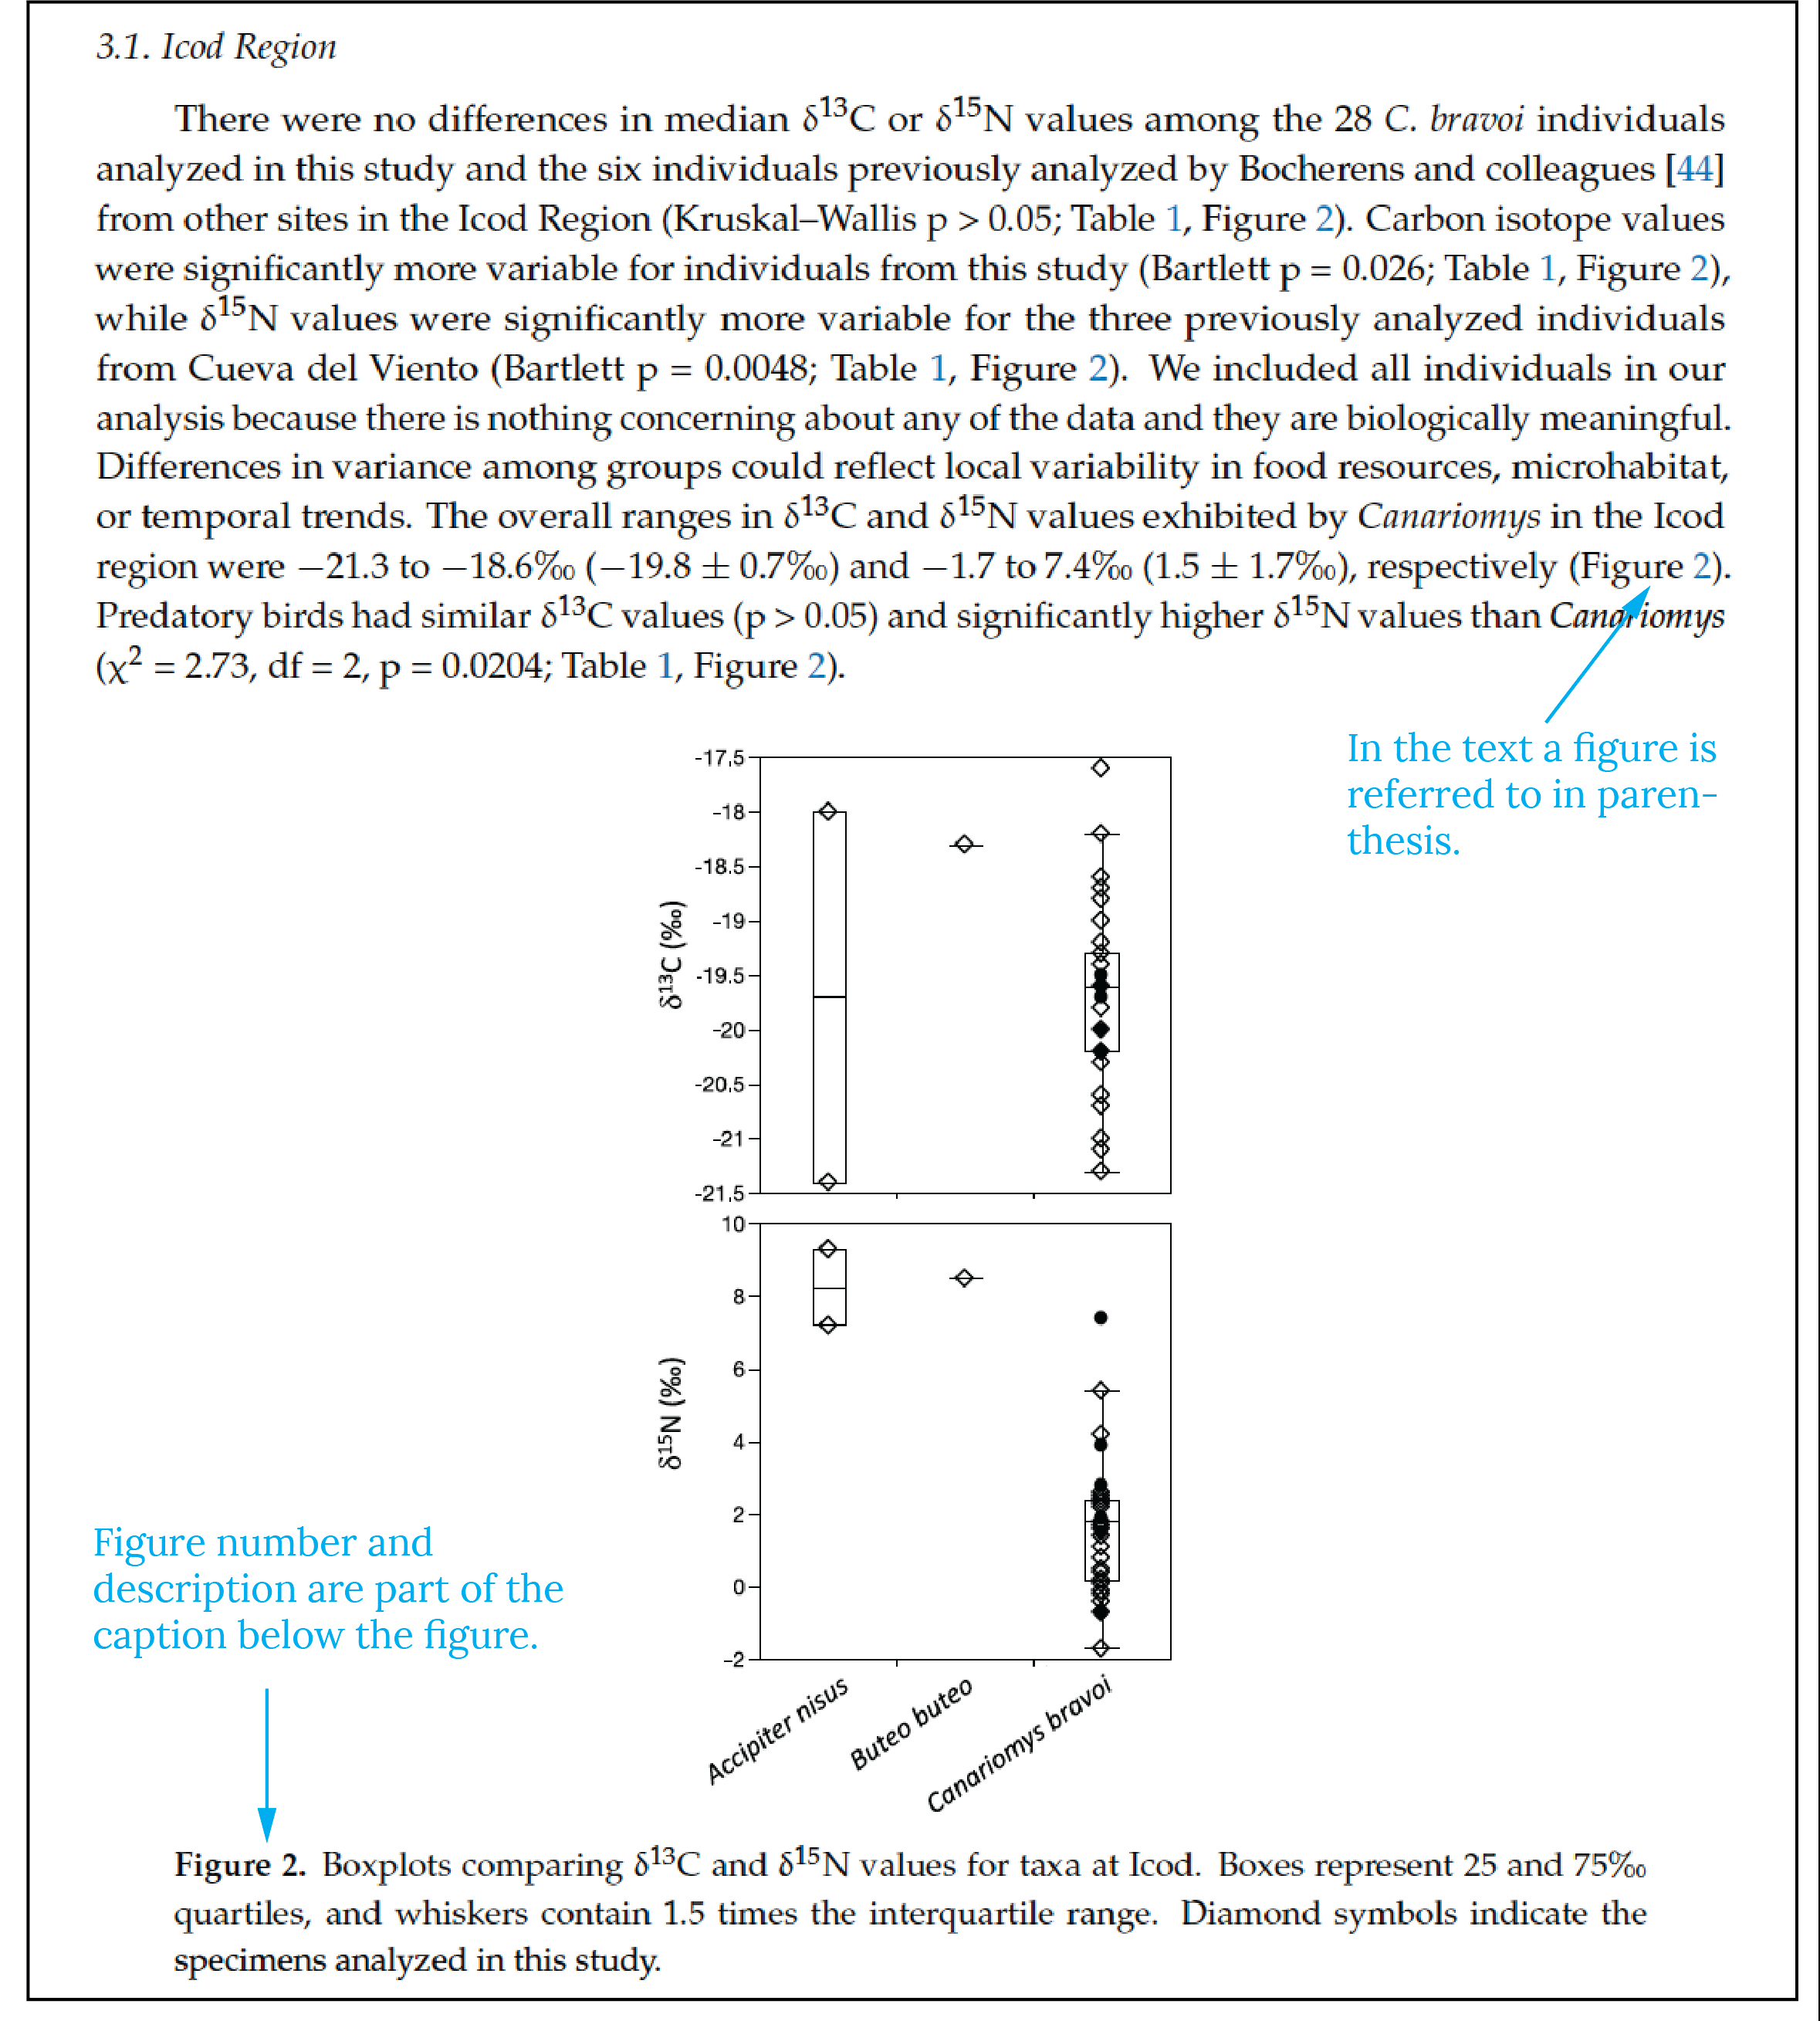
The word figure is used to describe any graphic in the document that is not a table. It can refer to photographs, drawings, diagrams, maps, and other type of illustrations. Fig. 2.7 shows a table and Fig. 2.8 shows results with a figure.
Writing Tips:
Be consistent in formatting for all figures and tables. Figure numbers and titles are listed in the caption below the figure. Table numbers and titles are listed above the table. Notes or source information are placed in the caption below the table. Figures and tables should be placed in the text where they are referred to and the reference to the figure or table should be in parenthetical text. Captions should be concise yet contain enough information for the reader to understand what the figure is about. Graphs should have clearly labeled legends.