
1 Chapter 1: The Science of Biology
Chapter 1 Outline
1.1 What is Life?
- 1.1.1 Composed of Biomolecules
- 1.1.2 Metabolize
- 1.1.3 Composed of Cells
- 1.1.4 Maintain Homeostasis
- 1.1.5 Respond to External Stimuli
- 1.1.6 Grow and Reproduce
- 1.1.7 Evolve
1.2 Scientific Inquiry
- 1.2.1 Scientific Method
- Designing the Scientific Study
- Collecting and Analyzing the Data
- Interpreting the Results
- Other Important Aspects
- Review of the Scientific Method
- 1.2.2 Scientific Theory
- 1.2.3 Reporting Results

Biology is the scientific study of life and its scope is very wide. Earth is home to a multitude of living beings or organisms. Our planet’s conditions – such as temperature, atmosphere, the presence of water and key elements such as carbon and nitrogen – are ideal for life. Tiny single-celled organisms began to appear shortly after the earth was formed over 4 billion years ago and since then there have been explosions of diversity in types of living things. Mammals did not appear until relatively recently, at about 200 million years ago, and only after many of the dinosaur species went extinct at 65 million years ago did the mammals begin to evolve into the forms we are familiar with today, such as deer, wolves, mice, bats, and monkeys. This book focuses on the study of the human species, which began its evolutionary pathway separate from apes only 6-8 million years ago, long after the first mammals appeared. Our modern human appearance did not appear until about 250 thousands years ago. Thus, while we focus on human biology in this book, we must recognize the close relationship between humans and other species. Not only do we share a recent evolutionary history, we also share the same biological foundations that will form the cornerstones of this book.
Before we dive into those biological foundations, we need to define what we are studying and how we study it. What is life? How do we study it scientifically?
1.1 What is Life?
Learning Objectives
You will be able to describe these characteristics of organisms:
- Composed of biomolecules
- Metabolize
- Composed of cells
- Maintain homeostasis
- Respond to external stimuli
- Grow and reproduce
- Evolve
Biology is the science that studies life. What exactly is life? This may sound like a silly question with an obvious answer, but it is not easy to define life. For example, a branch of biology called virology studies viruses, which exhibit some of the characteristics of living entities but lack others. It turns out that although viruses can attack living organisms, cause diseases, and even reproduce, they do not meet the criteria that biologists use to define life.
1.1.1 Composed of Biomolecules
All living things are composed of four basic types of biomolecules, most of which are probably familiar to you because three of them are nutrients that you obtain from your diet: carbohydrates, proteins, and lipids (fatty acids). The fourth, nucleic acids, includes deoxyribose nucleic acid or DNA, which is probably familiar to you as a substance that serves as an identity marker for individuals. You will learn more about these biomolecules -their structures and their functions – in later chapters.
1.1.2 Metabolize
A living organism’s metabolism refers to all of its chemical reactions. These chemical reactions include the process of breaking down food molecules and using those components to build the biomolecules that the organism needs. All organisms use a source of energy for their metabolic activities. Some organisms capture energy from the sun and convert it into chemical energy in food; others use chemical energy in molecules they take in as food.
Composed of Cells
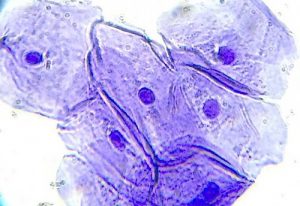
Organisms are highly organized, coordinated structures that consist of one or more cells (Figure 1.2). Most biologists do not consider anything without a cellular structure to be alive. Viruses, for instance, are composed of biomolecules but they are much smaller than a cell and do not have all of the complex structures of a cell. Even very simple, single-celled organisms are remarkably complex. You will learn more about cellular structure in later chapters, but a simple description of a cell is a structure that: 1) is composed on biomolecules; 2) has a complex outer membrane that encases its contents; and 3) contains organelles (similar to organs in your body – each organelle performs a certain vital function) and other cellular components inside of the membrane. In multi-cellular organisms such as dogs and humans, groups of similar cells form tissues. Tissues, in turn, collaborate to create organs (body structures with a distinct function). Organs work together to form organ systems, such as your nervous system or circulatory system.
Maintain Homeostasis
Even the smallest organisms are complex and require multiple regulatory mechanisms to coordinate internal functions, respond to stimuli, and cope with environmental stresses. Two examples of internal functions regulated in an organism are nutrient transport and blood flow. Organs (groups of tissues working together) perform specific functions, such as carrying oxygen throughout the body, removing wastes, delivering nutrients to every cell, and cooling the body.
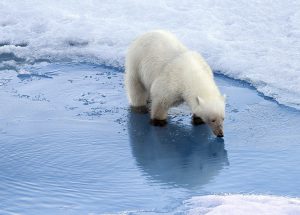
In order to function properly, cells need to have appropriate conditions such as proper temperature, pH, and appropriate concentration of diverse chemicals. These conditions may, however, change from one moment to the next. Organisms are able to maintain internal conditions within a narrow range almost constantly, despite environmental changes, through homeostasis (literally, “steady state”)—the ability of an organism to maintain constant internal conditions. For example, an organism needs to regulate body temperature through a process known as thermoregulation. Organisms that live in cold climates, such as the polar bear (Figure 1.3) have body structures that help them withstand low temperatures and conserve body heat. Structures that aid in this type of insulation include fur, feathers, blubber, and fat. In hot climates, organisms have methods (such as perspiration in humans or panting in dogs) that help them to shed excess body heat.
Respond to External Stimuli
Organisms respond to a wide array of external stimuli, such as noise, light, physical touch, and exposure to various chemical substances such as oxygen, toxins, or nutrients. You can consciously react to a stimulus, such as when you answer a question or move out of the way of an oncoming car. You also unconsciously react to stimuli. For instance, the pupils of your eyes will dilate if you enter a dark room. All living things react to stimuli, even plants that seemingly cannot move. However, plants can bend toward a source of light, climb on fences and walls, or respond to touch (Figure 1.4). Also, even tiny bacteria can move toward or away from chemicals (a process called chemotaxis) or light (phototaxis).

Grow and Reproduce
Organisms grow larger and develop following specific instructions coded for by their genes, which consist of DNA molecules (you’ll learn more about genes and DNA in later chapters). These genes provide instructions that will direct cellular growth and development, ensuring that a species’ young will grow up to exhibit many of the same characteristics as its parents.
Reproduction is the process of producing another similar organism (rarely is the new individual organism exactly the same as its parent). Single-celled organisms reproduce by first duplicating their DNA, and then dividing it equally as the cell prepares to divide to form two new cells. Multicellular organisms often produce specialized reproductive cells that will form new individuals. When reproduction occurs, genes containing DNA are passed along to an organism’s offspring. These genes ensure that the offspring will belong to the same species and will have similar characteristics, such as size and shape.
Evolve
Evolution simply means change. In the case of biological evolution, individual organisms do not evolve. Instead, populations evolve from one generation to the next. A population of wolves can evolve thicker fur if the climate becomes colder. Or a population of trees can evolve taller trunks if surrounding tree species are blocking too much of the sunlight. Bacteria can evolve defense mechanisms against drugs that we use to treat infections. Over many generations, the descending populations might look very different than their ancestors. Hence, the process of evolution eventually produced the vast diversity of living things on the planet (Figure 1.5).

1.2 Scientific Inquiry
Learning Objectives
You will be able to explain science as a process and as a way of understanding the natural world. This includes an understanding that:
- scientific knowledge is based on empirical evidence that is repeatedly examined through the scientific method and can change with new information
- scientific research studies must be carefully designed; that is, data must be collected, analyzed and interpreted in a rigorous manner
- results of scientific research must be effectively communicated to the scientific community and the public
- science has a significant impact on society and has the potential to provide benefits but also to the potential to do considerable harm, so the proper role of science must always be debated
Biology is a science, but what exactly is science? What does the study of biology share with other scientific disciplines? Science (from the Latin scientia, meaning “knowledge”) can be defined as knowledge that covers general truths or the operation of general laws, especially when acquired and tested by the scientific method. It becomes clear from this definition that the application of the scientific method plays a major role in science. The scientific method is the process of producing knowledge using a defined set of steps. One of the most important aspects of this method is the hypothesis, which is a suggested explanation of an observation. It is often referred to as an “educated guess” because the explanation is usually based on already-confirmed knowledge of similar phenomena (“educated”) but it has not yet been confirmed (“guess”). This potential explanation must be testable using experiments and/or further observations. Thus, the scientific method relies on empirical information – events that can be observed, such as seeing an animal respond to a stimulus, and measured, such as recording the height of a plant or counting the number of cells in a sample of blood. Scientists refer to this information as data.
1.2.1 Scientific Method
Designing the Scientific Study
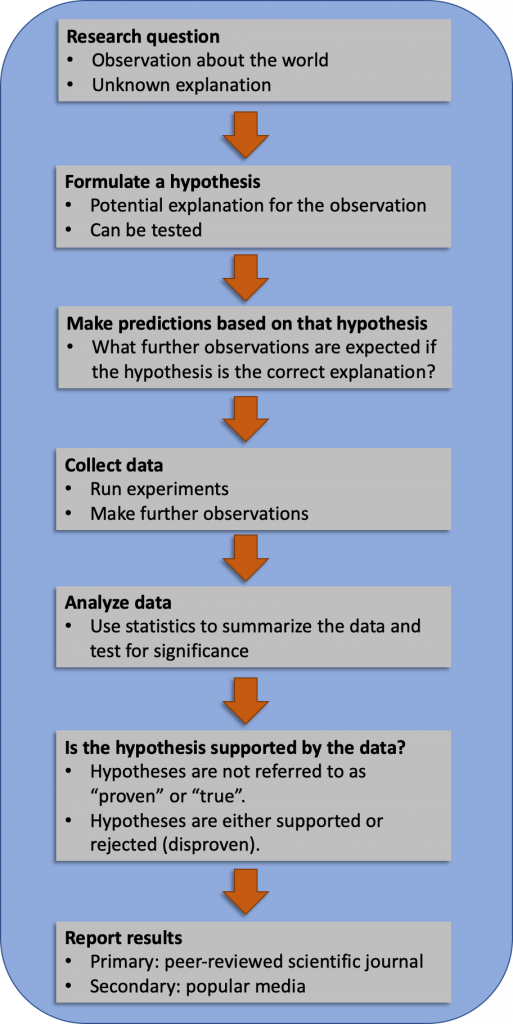
Gaining scientific knowledge about the natural world requires a researcher to carefully follow a series of steps that ensure the rigor and reliability of the results (Figure 1.6). This section will detail each of these steps.
The scientific process typically starts with an observation (often a problem to be solved) that leads to a research question that the study is attempting to answer. Let’s think about a simple problem that starts with an observation and apply the scientific method to solve the problem. One Monday morning, a student arrives at class and quickly discovers that the classroom is too warm. That is an observation that also describes a problem: the classroom is too warm. The student then asks a question: “Why is the classroom so warm?” Recall that a hypothesis is a suggested explanation that can be tested. To solve a problem, several hypotheses may be proposed. For example, one hypothesis might be, “The classroom is warm because no one turned on the air conditioning.” But there could be other responses to the question, and therefore other hypotheses may be proposed. A second hypothesis might be, “The classroom is warm because there is a power failure, and so the air conditioning doesn’t work.” A hypothesis must be testable to ensure that it is valid. For example, a hypothesis that depends on what a bear thinks is not testable, because it can never be known what a bear thinks. It should also be falsifiable, meaning that it can be disproven by experimental results. An example of an unfalsifiable hypothesis is “Botticelli’s Birth of Venus is beautiful.” There is no experiment that might show this statement to be false.
Once a hypothesis has been selected, a prediction can be made. A prediction is similar to a hypothesis but it typically has the format “If . . . then . . . .” For example, the prediction for the first hypothesis might be, “If the student turns on the air conditioning, then the classroom will no longer be too warm.”
To test a hypothesis, a researcher will conduct one or more experiments designed to eliminate one or more of the hypotheses. This is important. A hypothesis can be rejected or eliminated, but it can never be proven. Science does not deal in proofs like mathematics. If an experiment fails to disprove a hypothesis, then we find support for that explanation, but this is not to say that down the road a better explanation will not be found or a more carefully designed experiment will be found to falsify the hypothesis.
Each experiment will measure variables. A variable is any part of the experiment that can vary or change during the experiment. The independent variable is the part of the experiment that the researcher can control. The dependent variable is the part of the experiment that the researcher is attempting to affect by introducing the independent variable. As a simple example, an experiment might be conducted to test the hypothesis that phosphate limits the growth of algae in freshwater ponds. A series of artificial ponds are filled with water and half of them are treated by adding phosphate each week while the other half are not treated. The two parts of this experiment that can vary of change are: (1) the amount of phosphate, which includes lack of phosphate (or zero phosphate), and (2) the amount of growth of the algae. The amount of phosphate is the independent variable because the researcher decides how much phosphate, if any, to add to each pond. The growth of algae is the dependent variable, which might or might not be affected by the independent variable – that is the effect that the researcher is testing. The first group is the treatment or experimental group and the second group is the control group. It is crucial to have some sort control in a scientific study because the effect of the treatment (the independent variable) must be measured against some sort of baseline.
Collecting and Analyzing the Data
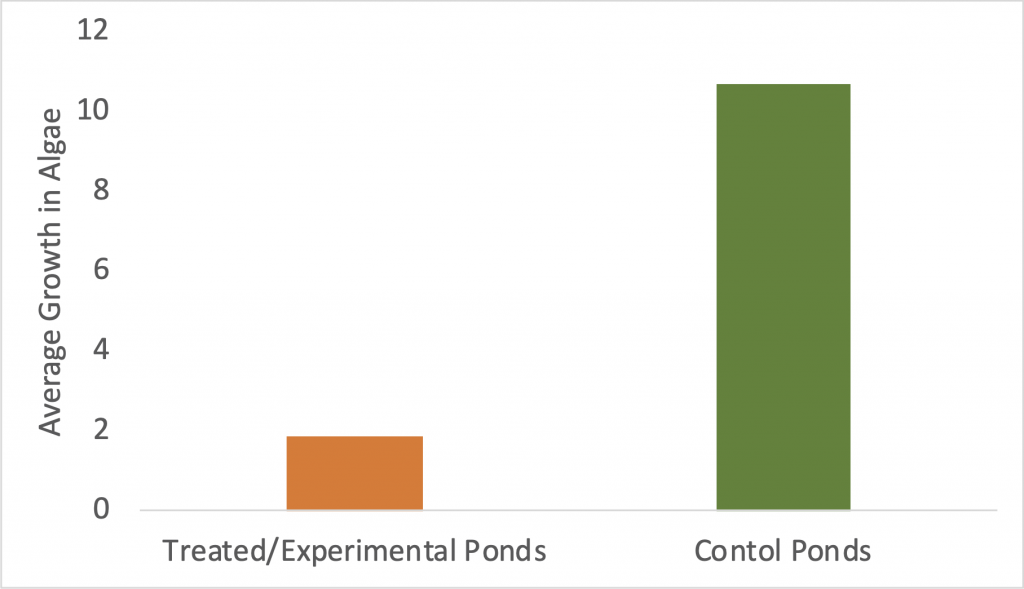
The researcher testing the effect of phosphate on algae growth would meticulously collect empirical data (note – the word “data” is plural; “datum” is the singular form or a research might refer to a single datapoint, such as a single measurement of the amount of algae in one pond on a given day) on the independent and dependent variables. She would keep careful records on when and how much phosphate is added to the treatment ponds. She would also carefully record the amount of algae growth at regular intervals in both the treatment and control ponds. Once all of the data are collected, she would analyze the data to determine whether her hypothesis is supported. Analysis first involves summarizing the data in a manner that is easy to visualize (see below for an expanded definition of analysis). Data are often quantitative (numerical), so raw data are just a list of numbers that are difficult to synthesize and intepret (Table 1.1). So, researchers will often create a graph that summarizes the results (Figure 1.7).
Table 1.1 Data on amount of algae after 4 weeks in ponds treated
with phosphate and control ponds without added phosphate.
| Treatment Ponds | Control Ponds | |
| 3.1 | 10.2 | |
| 1.2 | 9.7 | |
| 0.3 | 11.4 | |
| 2.8 | 12.0 | |
| 3.4 | 8.9 | |
| 2.5 | 10.4 | |
| 0.2 | 11.8 | |
| 1.6 | 12.1 | |
| 1.8 | 9.6 | |
| 1.7 | 10.8 | |
| Average | 1.86 | 10.69 |
Interpreting the Results
The graph summarizing the data (Figure 1.6) shows a large difference in algae growth between treated ponds (less growth) and control ponds (more growth), which supports her hypothesis. When a scientist finds support for her hypothesis, she does not say that this explanation is “true” because she knows that future experiments could show a different result, perhaps because of a variable that did not occur to her. For instance, the someone else may discover that the phosphate reacted with the lining of the artificial ponds, releasing a different toxic chemical that suppressed algae growth. If, instead, the data did not show a difference in algae growth, then she would reject her hypothesis. Be aware that rejecting one hypothesis does not determine whether or not another hypotheses can is supported (e.g. rejecting the the hypothesis that phosphate suppress algae growth does not mean there is support for the hypothesis that calcium carbonate suppresses algae growth). It simply eliminates one hypothesis or explanation.
Other Important Aspects
There are a few other critical aspects of scientific research that must be considered to ensure that a scientist can be confident that a hypothesis is either supported or rejected.
First, there is the issue of how research subjects are chosen and placed into either the experimental group or the control group. Research subjects are the units of interest in the study – they could be ponds that could grow algae, plants that could grow taller with a new fertilizer, or humans whose health could be improved with a new medication. Let’s say that a researcher is studying the effect of a new medication that is hypothesized to reduce blood pressure. He has access to several research subjects – people who have high blood pressure. He must determine which individuals will receive the new medication (experimental group) and which individuals will not receive medication (control group). Among his pool of research subjects, he notes that about half the individuals are female and about half of them are male. He also notes that they range in age – about half of the subjects are 40-55 years old and the other half are 56-70 years old. When determining which subjects should be in which group, he must be careful not to place all of the males in one group (for instance, the experimental group) and all of the females in the other group (for instance, the control group). Why? Because he will not be sure if the effect that he potentially finds is due to the new medication or if it is due to the differences between females and males. The same issue applies with age: if all of the younger individuals are in the experimental group and and all of the older individuals are in the control group, the resulting effect could be due to age rather than the medication. Thus, research subjects must be divided randomly according to their characteristics (such as sex and age). We call this process randominization – randomly assigning research subjects into either the experimental or control group. Imagine a deck of playing cards in which half the cards are red and half are black, and they also vary by number. To randomly sort the cards so that all of the red cards do not end up in one pile or all the low cards do not end up in one pile, you could shuffle the cards several times and then sort them (deal the cards) into two piles (Figure 1.8). Then, the two groups will be much more likely to have sets of similar characteristics – similar numbers of males and females, similar age range. The research will be much more likely to focus on the variables of interest to the study – i.e. the independent and dependent variables – rather than the other extraneous variables like age and sex.

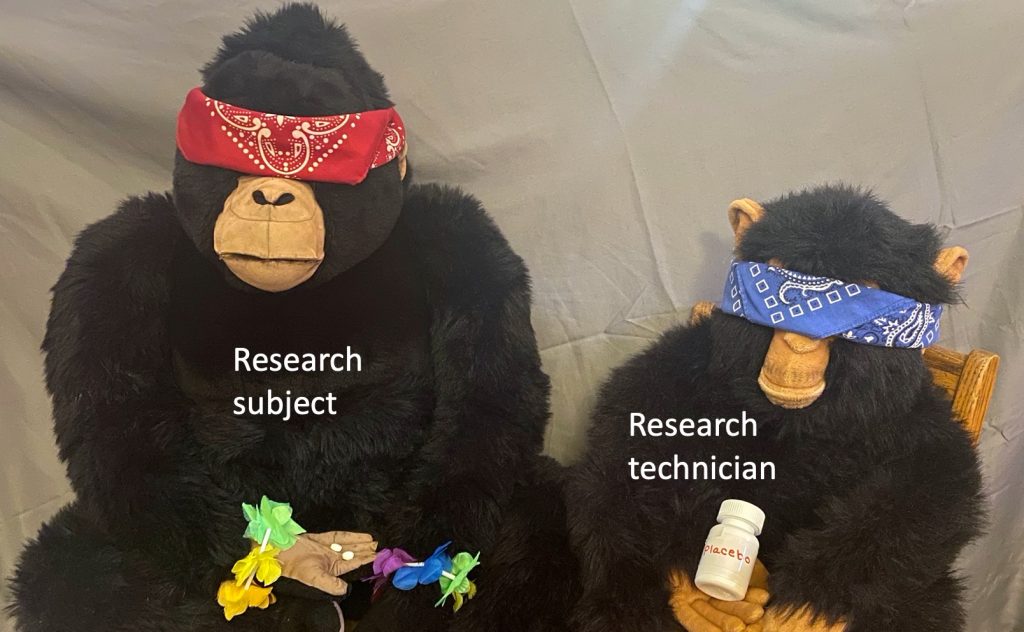
Second, there is the issue, in the case of research on human subjects, of researcher and subject expectation in which the participants in the study can create a bias that could skew the results. A human subject is aware that a research study is taking place and has consented to participate. This knowledge can create a psychological bias in which the subject expects some effect and thus imagines or creates this effect. Just imagining that one is taking a medication that could lower blood pressure could actually lower blood pressure because it might, for instance, decrease the psychological anxiety over having high blood pressure. It is impossible to completely mitigate this bias. However, there are ways to minimize it. One of the easiest ways to reduce bias is to not inform the research subjects whether they are in the experimental or control group. In this case, the subjects in the control group must be given a placebo, which is “fake” treatment such as sugar pills that have no effect on their health. The subject must not know whether they are receiving, for instance, the experimental medication or a placebo. This psychological bias can also be present in the researcher. The researcher might unconsciously treat a subject differently depending on whether the subject is in the experimental or control group. In many large clinical trials of a new medication, the head researcher never meets the research subjects. Instead, research technicians meet with and examine the research subjects, and these technicians are also unaware of which subjects are receiving treatment and which subjects are receiving a placebo. This aspect of research design, in which both the research technician and the research subject do not know which group they have been placed in, is called double-blind (Figure 1.9).
Third, analyzing data often requires more than just visualization on a graph. The data could show a difference simply due to chance. Statistical tests are one way to reduce the chances that the results are simply due to chance rather than the effect of the independent variable. Statistics in a discipline that involves the organization, analysis, interpretation of data. The calculation of “average amount of algae growth” in the example above (Table 1.1, Figure 1.6) is an example of a statistical operation. More sophisticated statistical tests allow a researcher to determine, with a high level of confidence, that a difference between two averages is due to some factor (such as the independent variable) rather than by chance. Imagine a researcher is conducting a study to determine whether a fertilizer has an effect on growth of a particular plant species. The independent variable is the amount of fertilizer and the dependent variable is the amount of plant growth. Notice that once the data are collected and the average amount of plant growth is calculated, the ranges of plant growth in experimental and control groups overlap and the averages for each group are very close (Table 1.2, Figure 1.10).
Table 1.2. Data on plant height growth in plants after 4 weeks
of treatment with a new fertilizer (treatment group) and
plants that have were not given any fertilizer (control group).
| Treatment Group | Control Group | |
| 30.8 | 29.3 | |
| 42.5 | 32.7 | |
| 38.7 | 25.8 | |
| 29.5 | 34.6 | |
| 37.9 | 27.9 | |
| 32.5 | 33.5 | |
| 33.4 | 32.3 | |
| 40.3 | 28.4 | |
| 39.8 | 34.5 | |
| 32.6 | 27.7 | |
| Average | 35.8 | 30.67 |
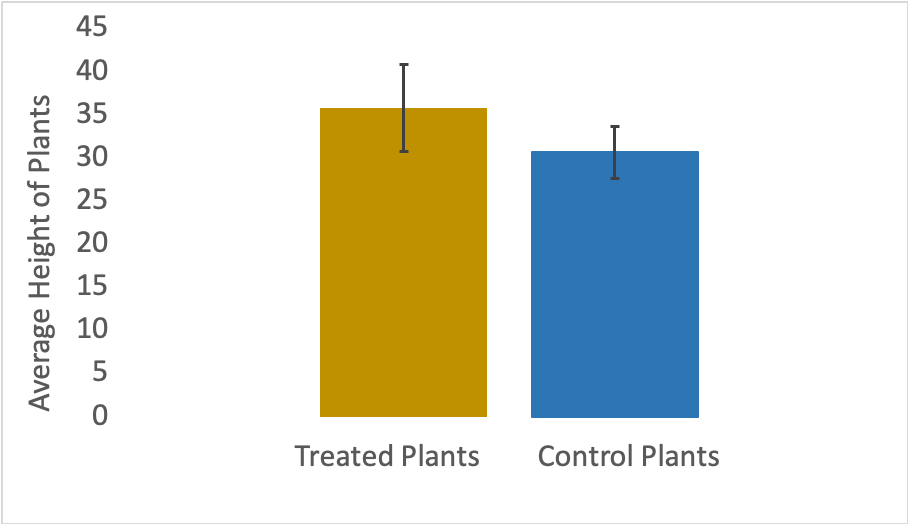
How does the researcher know whether this slight difference in averages is not simply due to chance? There are statistical equations that can be applied to the data that will inform the researcher of the likelihood that the difference is due to some effect rather than chance. These statistical analyses are never absolute – they can never tell the researcher with 100% confidence that the difference is not due to chance. But, they can provide a very high likelihood that the results are due to some real effect, which is called statistical significance. In the plant growth example, the statistical analysis shows with 99% confidence that the difference in averages between the experimental and control groups is not due to chance. Thus, these results provide support for the hypothesis (or, they could provide a reason to reject a given hypothesis). In sum, analysis of scientific data includes a summary of the data (calculating an average is an example of a summary statistic), a presentation of the results (in tables and graphs, for instance), and various statistical tests for significance differences.
Fourth, another important aspect of research design is sample size. The larger the sample size, the less likely that the results are due merely to chance. For example, a researcher hypothesizes that the students in first grade at School A are taller on average than the first-grade students at School B because School A is in a wealthier neighborhood so they have access to better nutrition. However, it would take far too much time and effort for the researcher to measure all 128 first-graders at School A and all 153 first-graders at School B. She must take a sample of students from each school. If she only measures two students per school, she could easily by chance measure two particularly short first-graders at School A and two particularly tall first-graders at School B, or vice versa. She must have a larger sample size to be more confident of her results. Many statistical tests have sample size built into the equation. Thus, in order to get a result that a researcher can be very confident is accurate (or statistically significant), then the researcher must have a large enough sample size.[1]
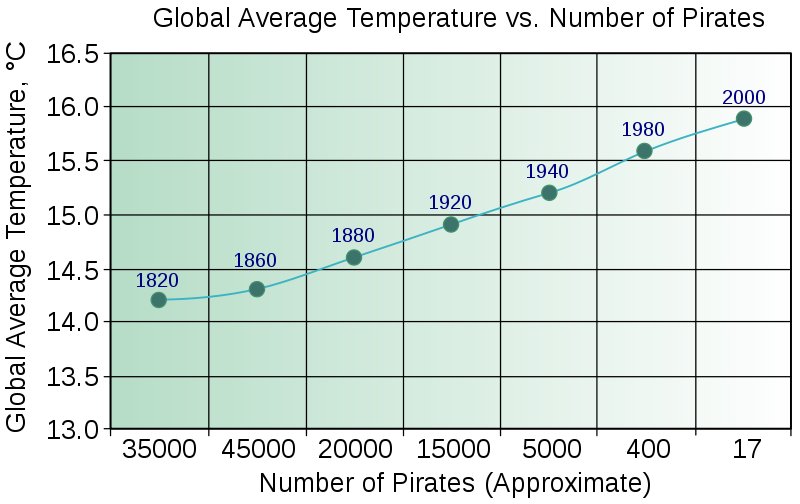
Fifth, there is a crucial issue that must be considered when analyzing and interpreting the results of a study. The two variables of interest – the independent and dependent variables – may be correlated but that does not mean that they are causally related. Correlation means that two variables are related – they vary at the same time and in a consistent manner. For example, in the case of the algae pond experiment, the presence of phosphate is correlated with a lack of growth in algae. In the case of the plant experiment, the application of the fertilizer is correlated taller average height of the plants. Causation means the one variable (presumably the independent variable that is controlled by the researcher, such as presence of phosphate or fertilizer) causes an effect in another variable (presumably the dependent variable). However, the correlation could be due simply to chance – a coincidence. Also, the correlation could be caused by a third (perhaps unknown) variable. For example, the rise in average global temperature is negatively correlated with the number of pirates in the world (Figure 1.11). Does this mean that the increase in global temperatures is caused by a lack of pirates? Or, that pirates have been disappearing because of the rising temperatures? Not likely. The rise in global temperatures is more likely caused by increased carbon in our atmosphere, whereas the decrease in the number of pirates is due to stronger ship construction and better security. Arguably, both of those causes are ultimately caused by increased global industrialization over the past 100 to 150 years.
In sum, though no correlation certainly indicates no causation, the presence of a correlation does not always indicate causation. Determining whether a correlation is an indication of causation can require a study that includes multiple variables instead of just two variables. In addition, scientific studies should be repeatable by other researchers and this repetition can help sort out correlation versus causation in some cases. For instance, another researcher might test a similar hypothesis with some changes in research design (e.g. another sample of research subjects with different characteristics) and find similar support for the hypothesis.
Review of the Scientific Method
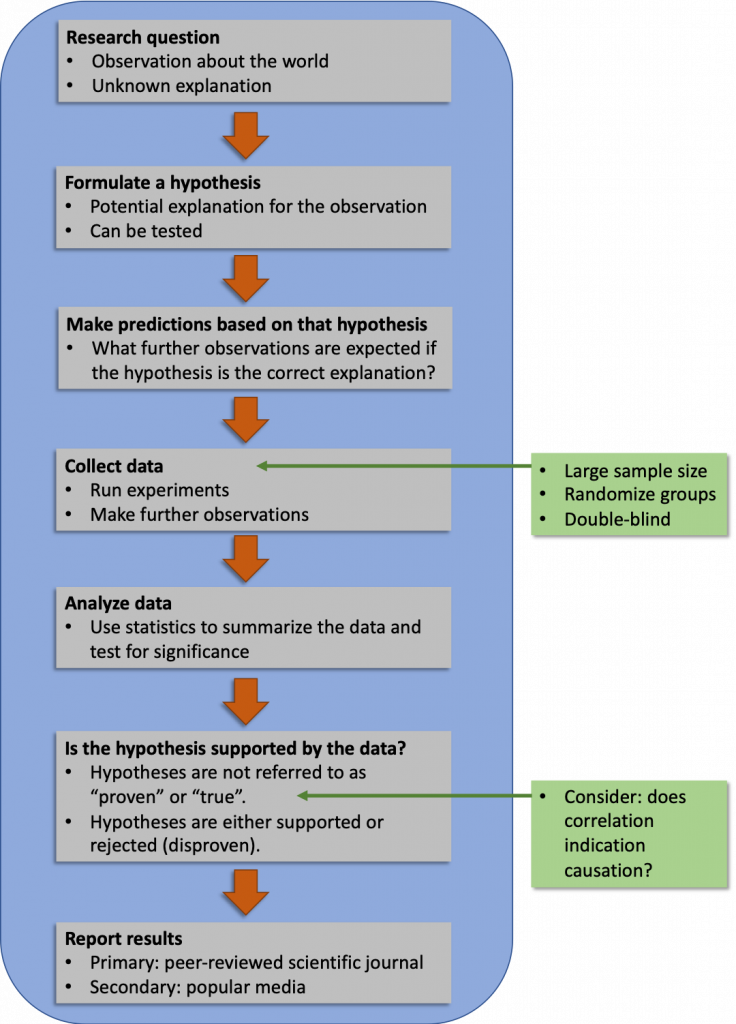
We have filled in more details of scientific research design and interpretation (Figure 1.12). Keeping all of these details in mind might seem overwhelming, but they are crucial to ensuring that a study produces reliable results.
1.2.2 Scientific Theory
Scientific theory is the foundation of scientific knowledge. Hypotheses, or tentative explanations, are generally produced within the context of a scientific theory. A scientific theory is a generally accepted, thoroughly tested and confirmed explanation for a set of observations or phenomena. It is like a framework of related hypotheses that have been tested and supported many times over.
A scientific theory is not the same thing as a fact. Facts are occurrences and observations while theories are explanations for why and how things happen. For example, an individual has an illness that makes their nasal passages swell and produce an excess of mucus. You can observe this fact. The explanation for their illness is germ theory – the idea that microbes causes these symptoms. Another example is evolution. You can observe the fossil record and see how the organisms change throughout the rock layers. The explanation for why and how populations change over time is evolutionary theory (you’ll learn more about evolutionary theory in later chapters). This explanation has been tested over and over again by a framework of similar hypotheses.
1.2.3 Reporting Results
Scientists must share their findings for other researchers to expand and build upon their discoveries. Communication and collaboration within and between the disciplines of science are key to the advancement of knowledge in science. Scientists can share results by presenting them at a scientific meeting or conference, but this approach can reach only the limited few who are present. Instead, most scientists present their results in peer-reviewed articles that are published in scientific journals, which are considered to be the primary source of the information. Peer-reviewed articles are scientific papers that are reviewed, usually anonymously by a scientist’s colleagues, or peers. These colleagues are qualified individuals, often experts in the same research area, who judge whether or not the scientist’s work is suitable for publication. The process of peer review helps to ensure that the research described in a scientific paper or grant proposal is original, significant, logical, and thorough. Grant proposals, which are requests for research funding, are also subject to peer review. Scientists publish their work so other scientists can reproduce their experiments under similar or different conditions to expand on the findings.
There are literally thousands of scientific journals that publish the work of researchers, each covering a very specific discipline and sub-discipline of science. Scientific journals are highly technical and rarely read outside of a small circle of scientists in that area. Most of the material that you find with a simple internet search is not directly from scientific journal. There are a large number of online open-access journals, journals with articles available without cost, are now available but do not often come up in a simple internet search. Many of these online journals use rigorous peer-review systems, but some of which do not. Results of any studies published in these forums without peer review are not reliable and should not form the basis for other scientific work.
However, there are many reliable secondary sources that are summaries of research that is published in primary-source scientific journals. For instance, Nature News, Science News, and Science Daily, are websites that publish articles about the latest scientific discoveries. These articles are not written by the scientists themselves. Instead, scientific journals translate the technical language of peer-reviewed articles into a form that the general public can understand. They provide a citation and a link to the primary peer-reviewed source at the end of the article.
Many popular news outlets also publish articles on scientific discoveries, such as The New York Times Science Section. These articles are also secondary sources but cite the primary source of the scientific knowledge from a peer-reviewed scientific journal.
Chapter is adapted from:
Concepts in Biology by Samantha Fowler, Rebecca Roush, and James Wise, published by OpenStax, licensed under CC BY 4.0, click here to access for free.
Media Attributions
- Chap 1 Apollo 8 © U.S Department of State is licensed under a Public Domain license
- Cells © biologycorner is licensed under a CC BY-NC (Attribution NonCommercial) license
- Polar Bear © Christopher Michel is licensed under a CC BY (Attribution) license
- Chap 1 senstive plant © Richard Wellis Sinyem is licensed under a CC BY-NC (Attribution NonCommercial) license
- Chap 1 gallery of evolution © Joe deSousa is licensed under a CC0 (Creative Commons Zero) license
- Chap 1 scientific method © Nancy Barrickman
- Chap 1 algae growth © Nancy Barrickman
- Chap 1 randomization deck of cards © Nancy Barrickman
- Chap 1 double blind © Nancy Barrickman
- Chap 1 plant growth error bars © Nancy Barrickman
- Chap 1 temperature and pirates © John Lester is licensed under a CC BY (Attribution) license
- Chap 1 Scientific method plus © Nancy Barrickman
- How large of a sample size is large enough? That is a complex question that involves many factors, such as how big of a difference is expected, how many variables is the researcher examining, how big of a range of measurements are there, and more. ↵
A tentative explanation for a question and/or observation of a phenomenon; must be testable using empirical (measurable, observable) data.
