
8 Chapter 8: Mendel’s Experiments and Heredity
Chapter Outline
- 8.1 Mendelian Genetics
- 8.2 Characteristics and Traits
- 8.3 Laws of Inheritance
- 8.4 Chromosomal Theory and Genetic Linkage
- 8.5 Chromosomal Basics of Inherited Disorders
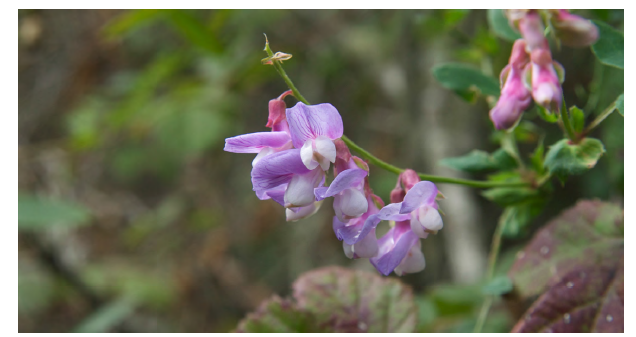
Figure 8.1 The species of pea plant the Gregor Mendel used in his experiments to discover patterns of inheritance.
Learning Objectives
You will be able to describe how traits are passed to offspring:
- Identify the relationship between chromosomes, genes and alleles.
- Understand the principles of simple inheritance
- Identify the terms homozygous, heterozygous, dominant and recessive
- Use a Punnett square to predict the inheritance of a simple trait
- Recognize that most human traits have complex inheritance patterns.
- Understand the genetics of sex determination
- Describe some examples of genetic disorders
- Understand how chromosomes contribute to disorders
8.1 | Mendelian Genetics
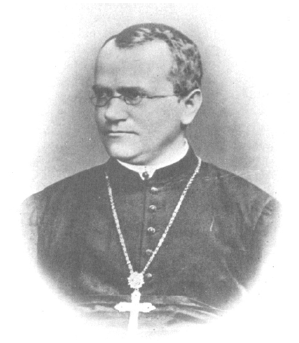
Figure 8.2 Johann Gregor Mendel is considered the father of genetics. 1.Johann Gregor Mendel, Versuche über Pflanzenhybriden Verhandlungen des naturforschenden Vereines in Brünn, Bd. IV für das Jahr, 1865 Abhandlungen,3–47. [for English translation see http://www.mendelweb.org/Mendel.plain.html]
Mendel’s Model System
Mendel’s seminal work was accomplished using the garden pea, Pisum sativum, to study inheritance. This species naturally self-fertilizes, such that pollen encounters ova within individual flowers. The flower petals remain sealed tightly until after pollination, preventing pollination from other plants. The result is highly inbred, or “true-breeding,” pea plants. These are plants that always produce offspring that look like the parent. By experimenting with true-breeding pea plants, Mendel avoided the appearance of unexpected traits in offspring that might occur if the plants were not true breeding. The garden pea also grows to maturity within one season, meaning that several generations could be evaluated over a relatively short time. Finally, large quantities of garden peas could be cultivated simultaneously, allowing Mendel to conclude that his results did not come about simply by chance.
Mendelian Crosses
Mendel performed hybridizations, which involve mating two true-breeding individuals that have different traits. In the pea,which is naturally self-pollinating, this is done by manually transferring pollen from the anther of a mature pea plant ofone variety to the stigma of a separate mature pea plant of the second variety. In plants, pollen carries the male gametes(sperm) to the stigma, a sticky organ that traps pollen and allows the sperm to move down the pistil to the female gametes(ova) below. To prevent the pea plant that was receiving pollen from self-fertilizing and confounding his results, Mendelpainstakingly removed all of the anthers from the plant’s flowers before they had a chance to mature.Plants used in first-generation crosses were called P0, or parental generation one, plants (Figure 12.3). Mendel collectedthe seeds belonging to the P0 plants that resulted from each cross and grew them the following season. These offspring werecalled the F1, or the first filial (filial = offspring, daughter or son), generation. Once Mendel examined the characteristicsin the F1 generation of plants, he allowed them to self-fertilize naturally. He then collected and grew the seeds from the F1plants to produce the F2, or second filial, generation. Mendel’s experiments extended beyond the F2 generation to the F3 andF4 generations, and so on, but it was the ratio of characteristics in the P0−F1−F2 generations that were the most intriguingand became the basis for Mendel’s postulates.
Chapter 12 | Mendel’s Experiments and Heredity 315
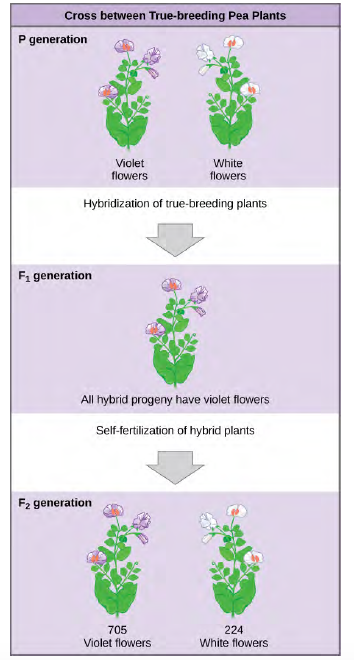
Figure 8.3 In one of his experiments on inheritance patterns, Mendel crossed plants that were true-breeding for violet flower color with plants true-breeding for white flower color (the P generation). The resulting hybrids in the F1generation all had violet flowers. In the F2 generation, approximately three quarters of the plants had violet flowers, and one quarter had white flowers.
Garden Pea Characteristics Revealed the Basics of Heredity
In his 1865 publication, Mendel reported the results of his crosses involving seven different characteristics, each with two contrasting traits. A trait is defined as a variation in the physical appearance of a heritable characteristic. The characteristics included plant height, seed texture, seed color, flower color, pea pod size, pea pod color, and flower position. For the characteristic of flower color, for example, the two contrasting traits were white versus violet. To fully examine each characteristic, Mendel generated large numbers of F1 and F2 plants, reporting results from 19,959 F2 plants alone. His findings were consistent.What results did Mendel find in his crosses for flower color? First, Mendel confirmed that he had plants that bred true for white or violet flower color. Regardless of how many generations Mendel examined, all self-crossed offspring of parents with white flowers had white flowers, and all self-crossed offspring of parents with violet flowers had violet flowers. In addition, Mendel confirmed that, other than flower color, the pea plants were physically identical.
Once these validations were complete, Mendel applied the pollen from a plant with violet flowers to the stigma of a plant with white flowers. After gathering and sowing the seeds that resulted from this cross, Mendel found that 100 percent of theF1 hybrid generation had violet flowers. Conventional wisdom at that time would have predicted the hybrid flowers to be pale violet or for hybrid plants to have equal numbers of white and violet flowers. In other words, the contrasting parental traits were expected to blend in the offspring. Instead, Mendel’s results demonstrated that the white flower trait in the F1 generation had completely disappeared.
Importantly, Mendel did not stop his experimentation there. He allowed the F1 plants to self-fertilize and found that, of F2-generation plants, 705 had violet flowers and 224 had white flowers. This was a ratio of 3.15 violet flowers per one white flower, or approximately 3:1. When Mendel transferred pollen from a plant with violet flowers to the stigma of a plant with white flowers and vice versa, he obtained about the same ratio regardless of which parent, male or female, contributed which trait. This is called a reciprocal cross—a paired cross in which the respective traits of the male and female in one cross become the respective traits of the female and male in the other cross. For the other six characteristics Mendel examined, the F1 and F2 generations behaved in the same way as they had for flower color. One of the two traits would disappear completely from the F1 generation only to reappear in the F2 generation at a ratio of approximately 3:1 (Table 12.1).
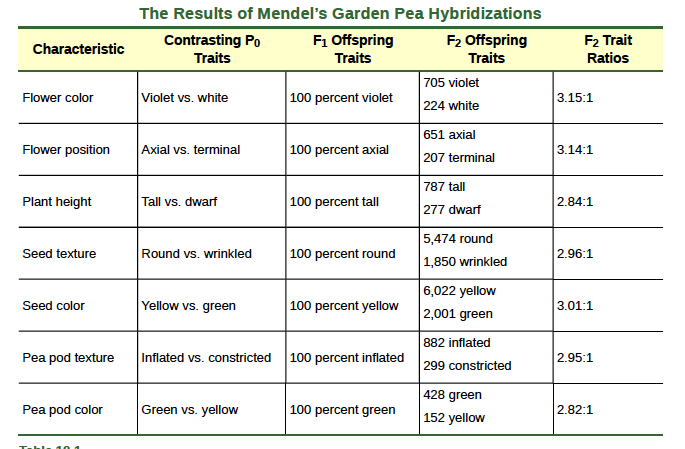
Table 8.1
Upon compiling his results for many thousands of plants, Mendel concluded that the characteristics could be divided into expressed and latent traits. He called these, respectively, dominant and recessive traits. Dominant traits are those that are inherited unchanged in a hybridization. Recessive traits become latent, or disappear, in the offspring of a hybridization.The recessive trait does, however, reappear in the progeny of the hybrid offspring. An example of a dominant trait is the violet-flower trait. For this same characteristic (flower color), white-colored flowers are a recessive trait. The fact that the recessive trait reappeared in the F2 generation meant that the traits remained separate (not blended) in the plants of the F1 generation.
Mendel also proposed that plants possessed two copies of the trait for the flower-color characteristic, and that each parent transmitted one of its two copies to its offspring, where they came together. Moreover, the physical observation of a dominant trait could mean that the genetic composition of the organism included two dominant versions of the characteristic or that it included one dominant and one recessive version. Conversely, the observation of a recessive trait meant that the organism lacked any dominant versions of this characteristic.
So why did Mendel repeatedly obtain 3:1 ratios in his crosses? To understand how Mendel deduced the basic mechanisms of inheritance that lead to such ratios, we must first review the laws of probability.
Probability Basics
Probabilities are mathematical measures of likelihood. The empirical probability of an event is calculated by dividing the number of times the event occurs by the total number of opportunities for the event to occur. It is also possible to calculate theoretical probabilities by dividing the number of times that an event is expected to occur by the number of times that it could occur. Empirical probabilities come from observations, like those of Mendel. Theoretical probabilities come from knowing how the events are produced and assuming that the probabilities of individual outcomes are equal. A probability of one for some event indicates that it is guaranteed to occur, whereas a probability of zero indicates that it is guaranteed not to occur.
8.2 | Characteristics and Traits
By the end of this section, you will be able to:• Explain the relationship between genotypes and phenotypes in dominant and recessive gene systems• Develop a Punnett square to calculate the expected proportions of genotypes and phenotypes in a monohybrid cross• Explain the purpose and methods of a test cross• Identify non-Mendelian inheritance patterns such as incomplete dominance, co-dominance, recessive lethals, multiple alleles, and sex linkage.
For cases in which a single gene controls a single characteristic, a diploid organism has two genetic copies that may or may not encode the same version of that characteristic. Gene variants that arise by mutation and exist at the same relative locations on homologous chromosomes are called alleles. Mendel examined the inheritance of genes with just two allele forms, but it is common to encounter more than two alleles for any given gene in a natural population.
Phenotypes and Genotypes
Two alleles for a given gene in a diploid organism are expressed and interact to produce physical characteristics. The observable traits expressed by an organism are referred to as its phenotype. An organism’s underlying genetic makeup, consisting of both physically visible and non-expressed alleles, is called its genotype. Mendel’s hybridization experiments demonstrate the difference between phenotype and genotype. When true-breeding plants in which one parent had yellow pods and one had green pods were cross-fertilized, all of the F1 hybrid offspring had yellow pods. That is, the hybrid offspring were phenotypically identical to the true-breeding parent with yellow pods. However, we know that the allele donated by the parent with green pods was not simply lost because it reappeared in some of the F2 offspring. Therefore, theF1 plants must have been genotypically different from the parent with yellow pods.The P1 plants that Mendel used in his experiments were each homozygous for the trait he was studying. Diploid organisms that are homozygous at a given gene, or locus, have two identical alleles for that gene on their homologous chromosomes.Mendel’s parental pea plants always bred true because both of the gametes produced carried the same trait. When P1 plants with contrasting traits were cross-fertilized, all of the offspring were heterozygous for the contrasting trait, meaning that their genotype reflected that they had different alleles for the gene being examined.
Dominant and Recessive Alleles
Our discussion of homozygous and heterozygous organisms brings us to why the F1 heterozygous offspring were identical to one of the parents, rather than expressing both alleles. In all seven pea-plant characteristics, one of the two contrasting alleles was dominant, and the other was recessive. Mendel called the dominant allele the expressed unit factor; the recessive allele was referred to as the latent unit factor. We now know that these so-called unit factors are actually genes on homologous chromosome pairs. For a gene that is expressed in a dominant and recessive pattern, homozygous dominant and heterozygous organisms will look identical (that is, they will have different genotypes but the same phenotype). The recessive allele will only be observed in homozygous recessive individuals (Table 8.4).
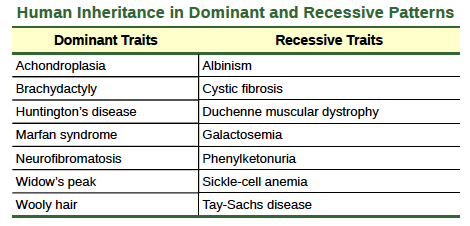
Table 8.4
Several conventions exist for referring to genes and alleles. For the purposes of this chapter, we will abbreviate genes using the first letter of the gene’s corresponding dominant trait. For example, violet is the dominant trait for a pea plant’s flower color, so the flower-color gene would be abbreviated as V (note that it is customary to italicize gene designations). Furthermore, we will use uppercase and lowercase letters to represent dominant and recessive alleles, respectively. Therefore, we would refer to the genotype of a homozygous dominant pea plant with violet flowers as VV, a homozygous recessive pea plant with white flowers as vv, and a heterozygous pea plant with violet flowers as Vv.
The Punnett Square Approach for a Monohybrid Cross
When fertilization occurs between two true-breeding parents that differ in only one characteristic, the process is called a monohybrid cross, and the resulting offspring are monohybrids. Mendel performed seven monohybrid crosses involving contrasting traits for each characteristic. On the basis of his results in F1 and F2 generations, Mendel postulated that each parent in the monohybrid cross contributed one of two paired unit factors to each offspring, and every possible combination of unit factors was equally likely.To demonstrate a monohybrid cross, consider the case of true-breeding pea plants with yellow versus green pea seeds.The dominant seed color is yellow; therefore, the parental genotypes were YY for the plants with yellow seeds and yy for the plants with green seeds, respectively.
A Punnett square, devised by the British geneticist Reginald Punnett, can be drawn that applies the rules of probability to predict the possible outcomes of a genetic cross or mating and their expected frequencies. To prepare a Punnett square, all possible combinations of the parental alleles are listed along the top (for one parent) and side (for the other parent) of a grid, representing their meiotic segregation into haploid gametes. Then the combinations of egg and sperm are made in the boxes in the table to show which alleles are combining. Each box then represents the diploid genotype of a zygote, or fertilized egg, that could result from this mating. Because each possibility is equally likely, genotypic ratios can be determined from a Punnett square. If the pattern of inheritance (dominant or recessive) is known, the phenotypic ratios can be inferred as well. For a monohybrid cross of two true-breeding parents, each parent contributes one type of allele. In this case, only one genotype is possible. All offspring are Yy and have yellow
seeds (Figure 8.4).
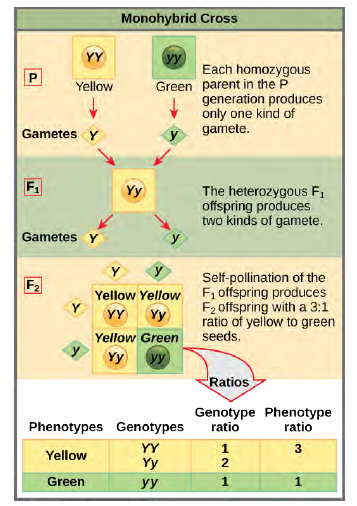
Figure 8.4 In the P generation, pea plants that are true-breeding for the dominant yellow phenotype are crossed with plants with the recessive green phenotype. This cross produces F1 heterozygotes with a yellow phenotype.
Punnett square analysis can be used to predict the genotypes of the F2 generation.A self-cross of one of the Yy heterozygous offspring can be represented in a Punnett square because each parent can donate one of two different alleles. Therefore, the offspring can potentially have one of four allele combinations: YY,Yy, yY, or yy (Figure 8.4). Notice that there are two ways to obtain the Yy genotype: a Y from the egg and a y from the sperm, or a y from the egg and a Y from the sperm. Both of these possibilities must be counted. Recall that Mendel’s pea plant characteristics behaved in the same way in reciprocal crosses. Therefore, the two possible heterozygous combinations produce offspring that are genotypically and phenotypically identical despite their dominant and recessive alleles deriving from different parents. They are grouped together. Because fertilization is a random event, we expect each combination to be equally likely and for the offspring to exhibit a ratio of YY:Yy:yy genotypes of 1:2:1 (Figure 8.4). Furthermore, because the YY and Yy offspring have yellow seeds and are phenotypically identical, applying the sum rule of probability, we expect the offspring to exhibit a phenotypic ratio of 3 yellow:1 green. Indeed, working with large sample sizes, Mendel observed approximately this ratio in every F2 generation resulting from crosses for individual traits.Mendel validated these results by performing an F3 cross in which he self-crossed the dominant- and recessive-expressingF2 plants. When he self-crossed the plants expressing green seeds, all of the offspring had green seeds, confirming that all green seeds had homozygous genotypes of yy. When he self-crossed the F2 plants expressing yellow seeds, he found that one-third of the plants bred true, and two-thirds of the plants segregated at a 3:1 ratio of yellow:green seeds. In this case, the true-breeding plants had homozygous (YY) genotypes, whereas the segregating plants corresponded to the heterozygous(Yy) genotype. When these plants self-fertilized, the outcome was just like the F1 self-fertilizing cross.
The Test Cross Distinguishes the Dominant Phenotype
Beyond predicting the offspring of a cross between known homozygous or heterozygous parents, Mendel also developed a way to determine whether an organism that expressed a dominant trait was a heterozygote or a homozygote. Called the test cross, this technique is still used by plant and animal breeders. In a test cross, the dominant-expressing organism is crossed with an organism that is homozygous recessive for the same characteristic. If the dominant-expressing organism is a homozygote, then all F1 offspring will be heterozygotes expressing the dominant trait (Figure 8.5). Alternatively, if the dominant expressing organism is a heterozygote, the F1 offspring will exhibit a 1:1 ratio of heterozygotes and recessive homozygotes (Figure 8.5). The test cross further validates Mendel’s postulate that pairs of unit factors segregate equally.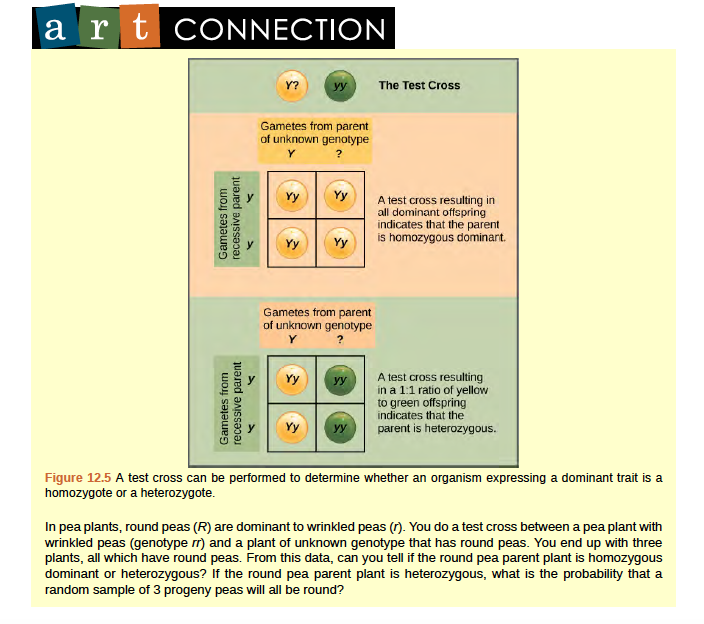
Figure 8.6 Alkaptonuria is a recessive genetic disorder in which two amino acids, phenylalanine and tyrosine, are not properly metabolized. Affected individuals may have darkened skin and brown urine, and may suffer joint damage and other complications. In this pedigree, individuals with the disorder are indicated in blue and have the genotype aa. Unaffected individuals are indicated in yellow and have the genotype AA or Aa. Note that it is often possible to determine a person’s genotype from the genotype of their offspring. For example, if neither parent has the disorder but their child does, they must be heterozygous. Two individuals on the pedigree have an unaffected phenotype but unknown genotype. Because they do not have the disorder, they must have at least one normal allele, so their genotype gets the “A?” designation.What are the genotypes of the individuals labeled 1, 2 and 3?
Alternatives to Dominance and Recessiveness
Mendel’s experiments with pea plants suggested that: (1) two “units” or alleles exist for every gene; (2) alleles maintain their integrity in each generation (no blending); and (3) in the presence of the dominant allele, the recessive allele is hidden and makes no contribution to the phenotype. Therefore, recessive alleles can be “carried” and not expressed by individuals.Such heterozygous individuals are sometimes referred to as “carriers.” Further genetic studies in other plants and animals have shown that much more complexity exists, but that the fundamental principles of Mendelian genetics still hold true. In the sections to follow, we consider some of the extensions of Mendelism. If Mendel had chosen an experimental system that exhibited these genetic complexities, it’s possible that he would not have understood what his results meant.
Incomplete Dominance
Mendel’s results, that traits are inherited as dominant and recessive pairs, contradicted the view at that time that offspring exhibited a blend of their parents’ traits. However, the heterozygote phenotype occasionally does appear to be intermediate between the two parents. For example, in the snapdragon, Antirrhinum majus (Figure 8.7), a cross between a homozygous parent with white flowers (CWCW) and a homozygous parent with red flowers (CRCR) will produce offspring with pink flowers (CRCW). (Note that different genotypic abbreviations are used for Mendelian extensions to distinguish these patterns from simple dominance and recessiveness.) This pattern of inheritance is described as incomplete dominance, denoting the expression of two contrasting alleles such that the individual displays an intermediate phenotype. The allele for redCRCW:1 CWCW, and the phenotypic ratio would be 1:2:1 for red:pink:white.
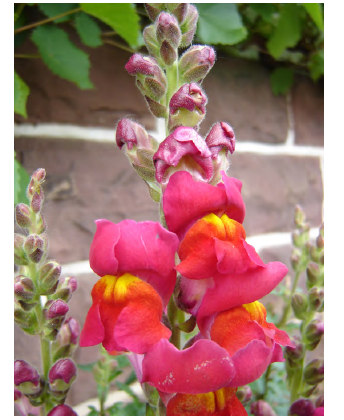
Figure 8.7 These pink flowers of a heterozygote snapdragon result from incomplete dominance. (credit:“storebukkebruse”/Flickr)
Codominance
A variation on incomplete dominance is codominance, in which both alleles for the same characteristic are simultaneously expressed in the heterozygote. An example of codominance is the MN blood groups of humans. The M and N alleles are expressed in the form of an M or N antigen present on the surface of red blood cells. Homozygotes (LMLM andLNLN) express either the M or the N allele, and heterozygotes (LMLN) express both alleles equally. In a self-cross between heterozygotes expressing a codominant trait, the three possible offspring genotypes are phenotypically distinct. However, the 1:2:1 genotypic ratio characteristic of a Mendelian monohybrid cross still applies.
Multiple Alleles
Mendel implied that only two alleles, one dominant and one recessive, could exist for a given gene. We now know that this is an oversimplification. Although individual humans (and all diploid organisms) can only have two alleles for a given gene, multiple alleles may exist at the population level such that many combinations of two alleles are observed. Note that when many alleles exist for the same gene, the convention is to denote the most common phenotype or genotype among wild animals as the wild type (often abbreviated “+”); this is considered the standard or norm. All other phenotypes or genotypes are considered variants of this standard, meaning that they deviate from the wild type. The variant may be recessive or dominant to the wild-type allele.An example of multiple alleles is coat color in rabbits (Figure 8.8). Here, four alleles exist for the c gene. The wild-type version, C+C+, is expressed as brown fur. The chinchilla phenotype, cchcch, is expressed as black-tipped white fur. TheHimalayan phenotype, chch, has black fur on the extremities and white fur elsewhere. Finally, the albino, or “colorless”phenotype, cc, is expressed as white fur. In cases of multiple alleles, dominance hierarchies can exist. In this case, the wild type allele is dominant over all the others, chinchilla is incompletely dominant over Himalayan and albino, and Himalayan is dominant over albino. This hierarchy, or allelic series, was revealed by observing the phenotypes of each possible heterozygote offspring.
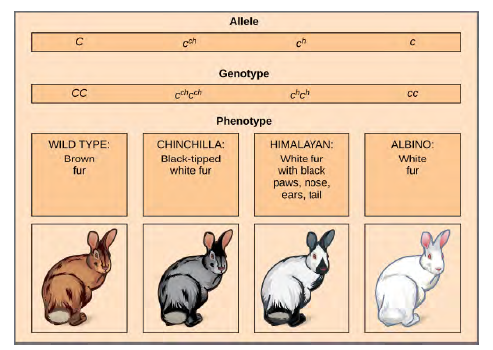
Figure 8.8 Four different alleles exist for the rabbit coat color (C) gene.The complete dominance of a wild-type phenotype over all other mutants often occurs as an effect of “dosage” of a specific gene product, such that the wild-type allele supplies the correct amount of gene product whereas the mutant alleles cannot.For the allelic series in rabbits, the wild-type allele may supply a given dosage of fur pigment, whereas the mutants supply a lesser dosage or none at all. Interestingly, the Himalayan phenotype is the result of an allele that produces a temperature sensitive gene product that only produces pigment in the cooler extremities of the rabbit’s body.Alternatively, one mutant allele can be dominant over all other phenotypes, including the wild type. This may occur when the mutant allele somehow interferes with the genetic message so that even a heterozygote with one wild-type allele copy expresses the mutant phenotype. One way in which the mutant allele can interfere is by enhancing the function of the wild type gene product or changing its distribution in the body. One example of this is the Antennapedia mutation in Drosophila(Figure 12.9). In this case, the mutant allele expands the distribution of the gene product, and as a result, the Antennapedia heterozygote develops legs on its head where its antennae should be.
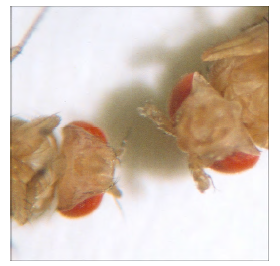
Figure 8.9 As seen in comparing the wild-type Drosophila (left) and the Antennapedia mutant (right), the Antennapedia mutant has legs on its head in place of antennae.
Multiple Alleles Confer Drug Resistance in the Malaria Parasite
Malaria is a parasitic disease in humans that is transmitted by infected female mosquitoes, including Anopheles gambiae (Figure 12.10a), and is characterized by cyclic high fevers, chills, flu-like symptoms, and severe anemia. Plasmodium falciparum and P. vivax are the most common causative agents of malaria, and P. falciparum is the most deadly (Figure 12.10b). When promptly and correctly treated, P. falciparum malaria has a mortality rate of 0.1 percent. However, in some parts of the world, the parasite has evolved resistance to commonly used malaria treatments, so the most effective malarial treatments can vary by geographic region.
(a) (b)
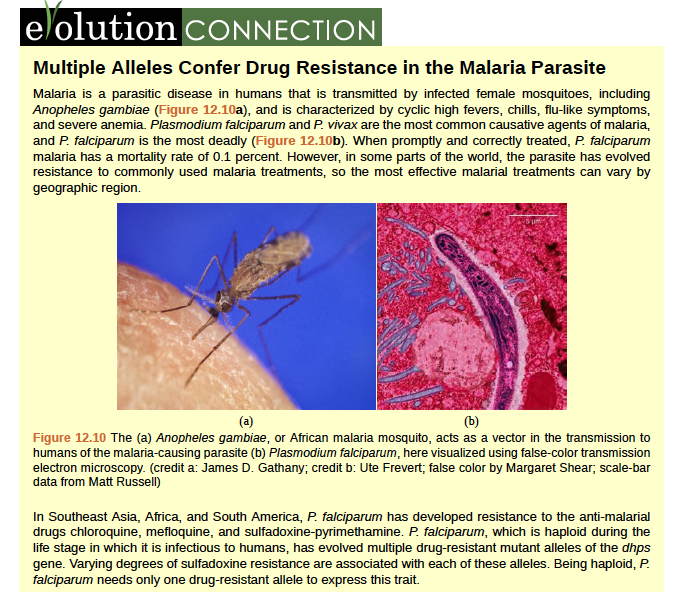
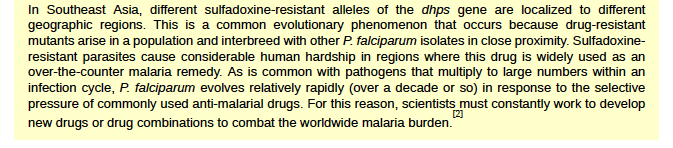
Figure 8.10
2. Sumiti Vinayak, et al., “Origin and Evolution of Sulfadoxine Resistant Plasmodium falciparum,” Public Library of Science Pathogens 6, no. 3 (2010):e1000830, doi:10.1371/journal.ppat.1000830.
X-Linked Traits
In humans, as well as in many other animals and some plants, the sex of the individual is determined by sex chromosomes.The sex chromosomes are one pair of non-homologous chromosomes. Until now, we have only considered inheritance patterns among non-sex chromosomes, or autosomes. In addition to 22 homologous pairs of autosomes, human females have a homologous pair of X chromosomes, whereas human males have an XY chromosome pair.
Although the Y chromosome contains a small region of similarity to the X chromosome so that they can pair during meiosis, the Y chromosome is much shorter and contains many fewer genes. When a gene being examined is present on the X chromosome, but not on the Y chromosome, it is said to be X-linked.Eye color in Drosophila was one of the first X-linked traits to be identified. Thomas Hunt Morgan mapped this trait to theX chromosome in 1910. Like humans, Drosophila males have an XY chromosome pair, and females are XX. In flies, the wild-type eye color is red (XW) and it is dominant to white eye color (Xw) (Figure 12.11). Because of the location of the eye-color gene, reciprocal crosses do not produce the same offspring ratios. Males are said to be hemizygous, because they have only one allele for any X-linked characteristic. Hemizygosity makes the descriptions of dominance and recessiveness irrelevant for XY males. Drosophila males lack a second allele copy on the Y chromosome; that is, their genotype can only be XWY or XwY. In contrast, females have two allele copies of this gene and can be XWXW, XWXw, or XwXw.
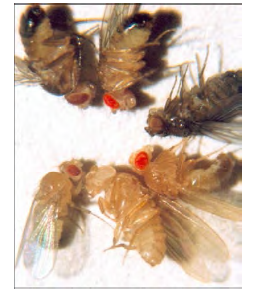
Figure 8.11 In Drosophila, several genes determine eye color.
The genes for white and vermilion eye colors are located on the X chromosome. Others are located on the autosomes. Clockwise from top left are brown, cinnabar, sepia, vermilion, white, and red. Red eye color is wild-type and is dominant to white eye color.In an X-linked cross, the genotypes of F1 and F2 offspring depend on whether the recessive trait was expressed by the male or the female in the P1 generation. With regard to Drosophila eye color, when the P1 male expresses the white-eye phenotype and the female is homozygous red-eyed, all members of the F1 generation exhibit red eyes (Figure 12.12).The F1 females are heterozygous (XWXw), and the males are all XWY, having received their X chromosome from the homozygous dominant P1 female and their Y chromosome from the P1 male. A subsequent cross between the XWXw female and the XWY male would produce only red-eyed females (with XWXW or XWXw genotypes) and both red- and white-eyed males (with XWY or XwY genotypes). Now, consider a cross between a homozygous white-eyed female and a male with red eyes. The F1 generation would exhibit only heterozygous red-eyed females (XWXw) and only white-eyed males (XwY).Half of the F2 females would be red-eyed (XWXw) and half would be white-eyed (XwXw). Similarly, half of the F2 males would be red-eyed (XWY) and half would be white-eyed (XwY).
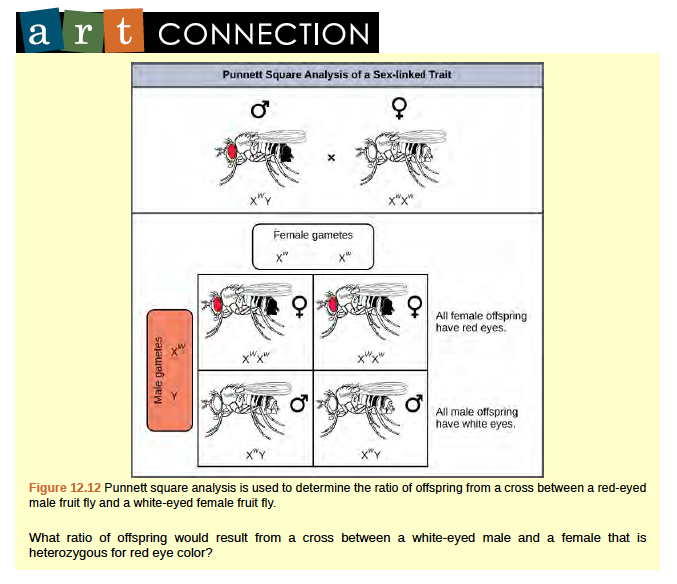
Figure 8.12
Discoveries in fruit fly genetics can be applied to human genetics. When a female parent is homozygous for a recessive X linked trait, she will pass the trait on to 100 percent of her offspring. Her male offspring are, therefore, destined to express the trait, as they will inherit their father’s Y chromosome. In humans, the alleles for certain conditions (some forms of colorblindness, hemophilia, and muscular dystrophy) are X-linked. Females who are heterozygous for these diseases are said to be carriers and may not exhibit any phenotypic effects. These females will pass the disease to half of their sons and will pass carrier status to half of their daughters; therefore, recessive X-linked traits appear more frequently in males than females.In some groups of organisms with sex chromosomes, the gender with the non-homologous sex chromosomes is the female rather than the male. This is the case for all birds. In this case, sex-linked traits will be more likely to appear in the female, in which they are hemizygous. Human Sex-linked DisordersSex-linkage studies in Morgan’s laboratory provided the fundamentals for understanding X-linked recessive disorders in humans, which include red-green color blindness, and Types A and B hemophilia. Because human males need to inherit only one recessive mutant X allele to be affected, X-linked disorders are disproportionately observed in males. Females must inherit recessive X-linked alleles from both of their parents in order to express the trait. When they inherit one recessiveX-linked mutant allele and one dominant X-linked wild-type allele, they are carriers of the trait and are typically unaffected. Carrier females can manifest mild forms of the trait due to the inactivation of the dominant allele located on one of the X chromosomes. However, female carriers can contribute the trait to their sons, resulting in the son exhibiting the trait, or they can contribute the recessive allele to their daughters, resulting in the daughters being carriers of the trait (Figure 12.13).Although some Y-linked recessive disorders exist, typically they are associated with infertility in males and are therefore not transmitted to subsequent generations.
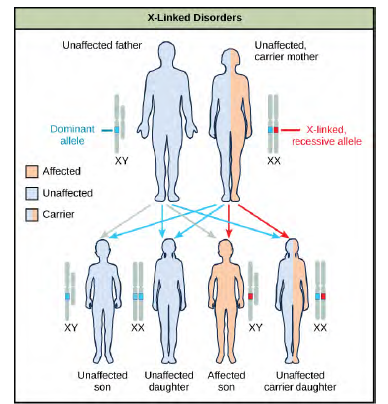
Figure 8.13 The son of a woman who is a carrier of a recessive X-linked disorder will have a 50 percent chance of being affected. A daughter will not be affected, but she will have a 50 percent chance of being a carrier like her mother.
Watch this video (http://openstaxcollege.org/l/sex-linked_trts) to learn more about sex-linked traits.
Lethality
A large proportion of genes in an individual’s genome are essential for survival. Occasionally, a nonfunctional allele for an essential gene can arise by mutation and be transmitted in a population as long as individuals with this allele also have a wild-type, functional copy. The wild-type allele functions at a capacity sufficient to sustain life and is therefore considered to be dominant over the nonfunctional allele. However, consider two heterozygous parents that have a genotype of wild type/nonfunctional mutant for a hypothetical essential gene. In one quarter of their offspring, we would expect to observe individuals that are homozygous recessive for the nonfunctional allele. Because the gene is essential, these individuals might fail to develop past fertilization, die in utero, or die later in life, depending on what life stage requires this gene.
Dominant lethal alleles are very rare because, as you might expect, the allele only lasts one generation and is not transmitted. However, just as the recessive lethal allele might not immediately manifest the phenotype of death, dominant lethal alleles also might not be expressed until adulthood. Once the individual reaches reproductive age, the allele may be unknowingly passed on, resulting in a delayed death in both generations. An example of this in humans is Huntington’s disease, in which the nervous system gradually wastes away (Figure 12.14).People who are heterozygous for the dominant Huntington allele (Hh) will inevitably develop the fatal disease. However, the onset of Huntington’s disease may not occur until age 40, at which point the afflicted persons may have already passed the allele to 50 percent of their offspring.
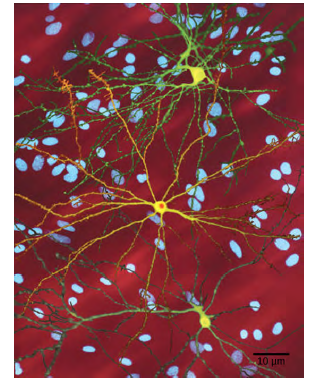
Figure 8.14 The neuron in the center of this micrograph (yellow) has nuclear inclusions characteristic of Huntington’sdisease (orange area in the center of the neuron). Huntington’s disease occurs when an abnormal dominant allele forthe Huntington gene is present. (credit: Dr. Steven Finkbeiner, Gladstone Institute of Neurological Disease, The Taube-Koret Center for Huntington’s Disease Research, and the University of California San Francisco/Wikimedia)
8.3 | Laws of Inheritance
By the end of this section, you will be able to:
- Explain Mendel’s law of segregation and independent assortment in terms of genetics and the events of meiosis
- Use the forked-line method and the probability rules to calculate the probability of genotypes and phenotypes from multiple gene crosses
- Explain the effect of linkage and recombination on gamete genotypes
- Explain the phenotypic outcomes of epistatic effects between genes
Mendel generalized the results of his pea-plant experiments into four postulates, some of which are sometimes called“laws,” that describe the basis of dominant and recessive inheritance in diploid organisms. As you have learned, more complex extensions of Mendelism exist that do not exhibit the same F2 phenotypic ratios (3:1). Nevertheless, these laws summarize the basics of classical genetics.
Pairs of Unit Factors, or Genes
Mendel proposed first that paired unit factors of heredity were transmitted faithfully from generation to generation by the dissociation and reassociation of paired factors during gametogenesis and fertilization, respectively. After he crossed peas with contrasting traits and found that the recessive trait resurfaced in the F2 generation, Mendel deduced that hereditary factors must be inherited as discrete units. This finding contradicted the belief at that time that parental traits were blended in the offspring.
Alleles Can Be Dominant or Recessive
Mendel’s law of dominance states that in a heterozygote, one trait will conceal the presence of another trait for the same characteristic. Rather than both alleles contributing to a phenotype, the dominant allele will be expressed exclusively. The recessive allele will remain “latent” but will be transmitted to offspring by the same manner in which the dominant allele is transmitted. The recessive trait will only be expressed by offspring that have two copies of this allele (Figure 12.15), and these offspring will breed true when self-crossed.
Since Mendel’s experiments with pea plants, other researchers have found that the law of dominance does not always hold true. Instead, several different patterns of inheritance have been found to exist.
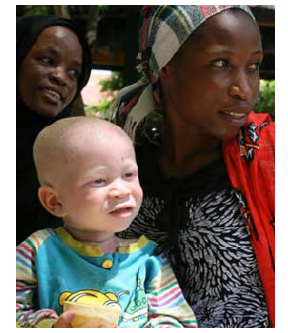
Figure 8.15 The child in the photo expresses albinism, a recessive trait.
Equal Segregation of Alleles
Observing that true-breeding pea plants with contrasting traits gave rise to F1 generations that all expressed the dominant trait and F2 generations that expressed the dominant and recessive traits in a 3:1 ratio, Mendel proposed the law of segregation. This law states that paired unit factors (genes) must segregate equally into gametes such that offspring have an equal likelihood of inheriting either factor. For the F2 generation of a monohybrid cross, the following three possible combinations of genotypes could result: homozygous dominant, heterozygous, or homozygous recessive. Because heterozygotes could arise from two different pathways (receiving one dominant and one recessive allele from either parent), and because heterozygotes and homozygous dominant individuals are phenotypically identical, the law supports Mendel’s observed 3:1 phenotypic ratio. The equal segregation of alleles is the reason we can apply the Punnett square to accurately predict the offspring of parents with known genotypes. The physical basis of Mendel’s law of segregation is the first division of meiosis, in which the homologous chromosomes with their different versions of each gene are segregated into daughter nuclei. The role of the meiotic segregation of chromosomes in sexual reproduction was not understood by the scientific community during Mendel’s lifetime.
Independent Assortment
Mendel’s law of independent assortment states that genes do not influence each other with regard to the sorting of alleles into gametes, and every possible combination of alleles for every gene is equally likely to occur. The independent assortment of genes can be illustrated by the dihybrid cross, a cross between two true-breeding parents that express different traits for two characteristics. Consider the characteristics of seed color and seed texture for two pea plants, one that has green, wrinkled seeds (yyrr) and another that has yellow, round seeds (YYRR). Because each parent is homozygous, the law of segregation indicates that the gametes for the green/wrinkled plant all are yr, and the gametes for the yellow/round plant are all YR. Therefore, the F1 generation of offspring all are YyRr (Figure 12.16).
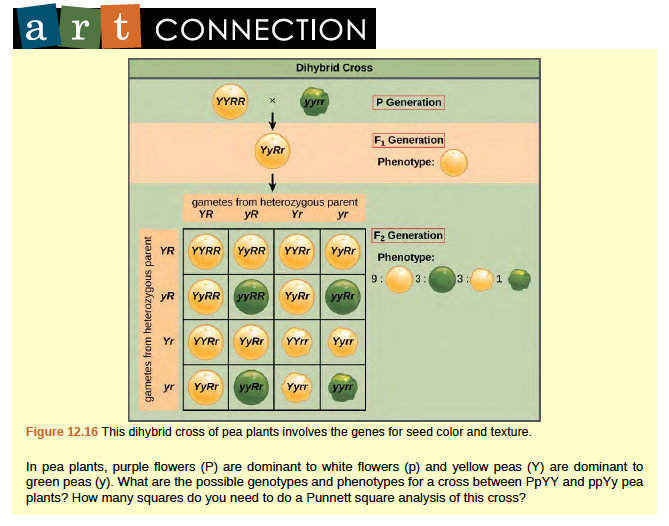
Figure 8.16
For the F2 generation, the law of segregation requires that each gamete receive either an R allele or an r allele along with either a Y allele or a y allele. The law of independent assortment states that a gamete into which an r allele sorted would be equally likely to contain either a Y allele or a y allele. Thus, there are four equally likely gametes that can be formed when the YyRr heterozygote is self-crossed, as follows: YR, Yr, yR, and yr. Arranging these gametes along the top and left of a 4 by 4 Punnett square (Figure 12.16) gives us 16 equally likely genotypic combinations. From these genotypes, we infer a phenotypic ratio of 9 round/yellow:3 round/green:3 wrinkled/yellow:1 wrinkled/green (Figure 12.16). These are the offspring ratios we would expect, assuming we performed the crosses with a large enough sample size. Because of independent assortment and dominance, the 9:3:3:1 dihybrid phenotypic ratio can be collapsed into two 3:1 ratios, characteristic of any monohybrid cross that follows a dominant and recessive pattern. Ignoring seed color and considering only seed texture in the above dihybrid cross, we would expect that three quarters of the F2 generation offspring would be round, and one quarter would be wrinkled. Similarly, isolating only seed color, we would assume that three quarters of the F2 offspring would be yellow and one quarter would be green. The sorting of alleles for texture and color are independent events, so we can apply the product rule. Therefore, the proportion of round and yellow F2 offspring is expected to be (3/4) Å~ (3/4) = 9/16, and the proportion of wrinkled and green offspring is expected to be (1/4) Å~ (1/4) = 1/16.
These proportions are identical to those obtained using a Punnett square. Round, green and wrinkled, yellow offspring can also be calculated using the product rule, as each of these genotypes includes one dominant and one recessive phenotype. Therefore, the proportion of each is calculated as (3/4) Å~ (1/4) = 3/16. The law of independent assortment also indicates that a cross between yellow, wrinkled (YYrr) and green, round (yyRR) parents would yield the same F1 and F2 offspring as in the YYRR x yyrr cross.
Linked Genes Violate the Law of Independent Assortment
Although all of Mendel’s pea characteristics behaved according to the law of independent assortment, we now know that some allele combinations are not inherited independently of each other. Genes that are located on separate nonhomologous chromosomes will always sort independently. However, each chromosome contains hundreds or thousands of genes, organized linearly on chromosomes like beads on a string. The segregation of alleles into gametes can be influenced by linkage, in which genes that are located physically close to each other on the same chromosome are more likely to be inherited as a pair. However, because of the process of recombination, or “crossover,” it is possible for two genes on the same chromosome to behave independently, or as if they are not linked. To understand this, let’s consider the biological basis of gene linkage and recombination.
Homologous chromosomes possess the same genes in the same linear order. The alleles may differ on homologous chromosome pairs, but the genes to which they correspond do not. In preparation for the first division of meiosis, homologous chromosomes replicate and synapse. Like genes on the homologs align with each other. At this stage, segments of homologous chromosomes exchange linear segments of genetic material (Figure 12.18). This process is called recombination, or crossover, and it is a common genetic process. Because the genes are aligned during recombination, the gene order is not altered. Instead, the result of recombination is that maternal and paternal alleles are combined onto the same chromosome. Across a given chromosome, several recombination events may occur, causing extensive shuffling of alleles.
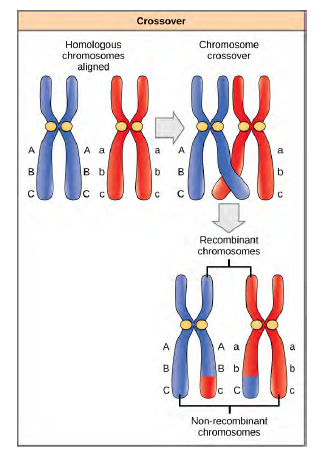
Figure 8.18 The process of crossover, or recombination, occurs when two homologous chromosomes align during meiosis and exchange a segment of genetic material. Here, the alleles for gene C were exchanged. The result is two recombinant and two non-recombinant chromosomes.
When two genes are located in close proximity on the same chromosome, they are considered linked, and their alleles tend to be transmitted through meiosis together. To exemplify this, imagine a dihybrid cross involving flower color and plant height in which the genes are next to each other on the chromosome. If one homologous chromosome has alleles for tall plants and red flowers, and the other chromosome has genes for short plants and yellow flowers, then when the gametes are formed, the tall and red alleles will go together into a gamete and the short and yellow alleles will go into other gametes. These are called the parental genotypes because they have been inherited intact from the parents of the individual producing gametes. But unlike if the genes were on different chromosomes, there will be no gametes with tall and yellow alleles and no gametes with short and red alleles. If you create the Punnett square with these gametes, you will see that the classical Mendelian prediction of a 9:3:3:1 outcome of a dihybrid cross would not apply. As the distance between two genes increases, the probability of one or more crossovers between them increases, and the genes behave more like they are on separate chromosomes. Geneticists have used the proportion of recombinant gametes (the ones not like the parents) as a measure of how far apart genes are on a chromosome. Using this information, they have constructed elaborate maps of genes on chromosomes for well-studied organisms, including humans. Mendel’s seminal publication makes no mention of linkage, and many researchers have questioned whether he encountered linkage but chose not to publish those crosses out of concern that they would invalidate his independent assortment postulate. The garden pea has seven chromosomes, and some have suggested that his choice of seven characteristics was not a coincidence. However, even if the genes he examined were not located on separate chromosomes, it is possible that he simply did not observe linkage because of the extensive shuffling effects of recombination.
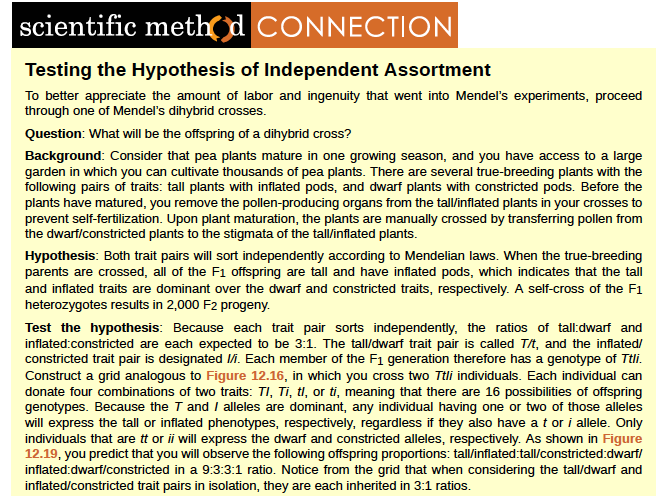
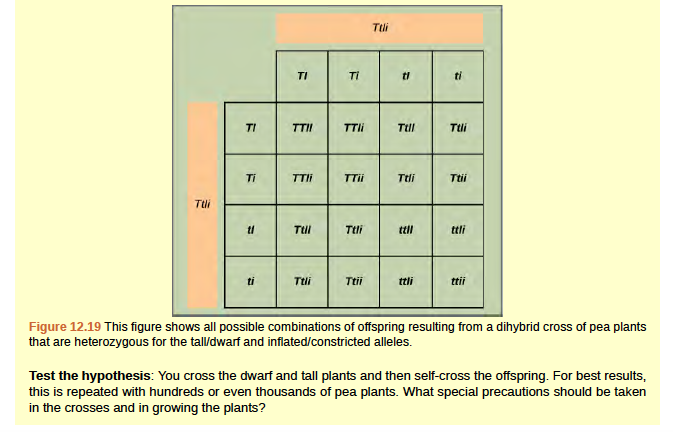
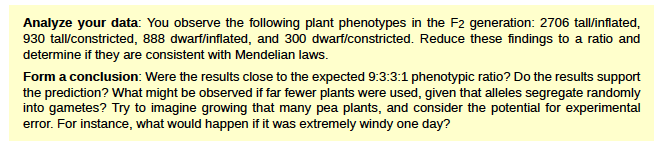
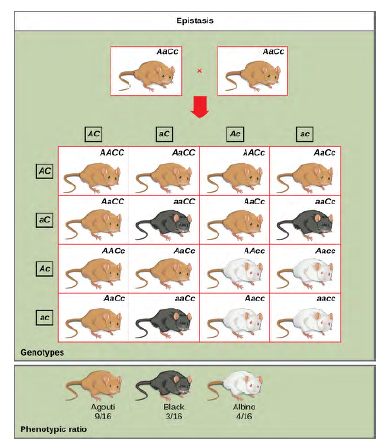
Figure 8.20 In mice, the mottled agouti coat color (A) is dominant to a solid coloration, such as black or gray. A gene at a separate locus (C) is responsible for pigment production. The recessive c allele does not produce pigment, and a mouse with the homozygous recessive cc genotype is albino regardless of the allele present at the A locus. Thus, the C gene is epistatic to the A gene. Epistasis can also occur when a dominant allele masks expression at a separate gene.
Fruit color in summer squash is expressed in this way. Homozygous recessive expression of the W gene (ww) coupled with homozygous dominant or heterozygous expression of the Y gene (YY or Yy) generates yellow fruit, and the wwyy genotype produces green fruit. However, if a dominant copy of the W gene is present in the homozygous or heterozygous form, the summer squash will produce white fruit regardless of the Y alleles. A cross between white heterozygotes for both genes (WwYy Å~ WwYy) would produce offspring with a phenotypic ratio of 12 white:3 yellow:1 green.
Finally, epistasis can be reciprocal such that either gene, when present in the dominant (or recessive) form, expresses the same phenotype. In the shepherd’s purse plant (Capsella bursa-pastoris), the characteristic of seed shape is controlled by two genes in a dominant epistatic relationship. When the genes A and B are both homozygous recessive (aabb), the seeds are ovoid. If the dominant allele for either of these genes is present, the result is triangular seeds. That is, every possible genotype other than aabb results in triangular seeds, and a cross between heterozygotes for both genes (AaBb x AaBb) would yield offspring with a phenotypic ratio of 15 triangular:1 ovoid.
For an excellent review of Mendel’s experiments and to perform your own crosses and identify patterns of inheritance, visit the Mendel’s Peas (http://openstaxcollege.org/l/mendels_peas) web lab.
Figure 8.21 Chromosomes are threadlike nuclear structures consisting of DNA and proteins that serve as the repositories for genetic information. The chromosomes depicted here were isolated from a fruit fly’s salivary gland, stained with dye, and visualized under a microscope. Akin to miniature bar codes, chromosomes absorb different dyes to produce characteristic banding patterns, which allows for their routine identification. (credit: modification of work by“LPLT”/Wikimedia Commons; scale-bar data from Matt Russell)
8.4 | Chromosomal Theory and Genetic Linkage
Long before chromosomes were visualized under a microscope, the father of modern genetics, Gregor Mendel, began studying heredity in 1843.With the improvement of microscopic techniques during the late 1800s, cell biologists could stain and visualize subcellular structures with dyes and observe their actions during cell division and meiosis. With each mitotic division, chromosomes replicated, condensed from an amorphous (no constant shape) nuclear mass into distinct X-shaped bodies (pairs of identical sister chromatids), and migrated to separate cellular poles.
The speculation that chromosomes might be the key to understanding heredity led several scientists to examine Mendel’s publications and re-evaluate his model in terms of the behavior of chromosomes during mitosis and meiosis. In 1902, Theodor Boveri observed that proper embryonic development of sea urchins does not occur unless chromosomes are present. That same year, Walter Sutton observed the separation of chromosomes into daughter cells during meiosis (Figure13.2). Together, these observations led to the development of the Chromosomal Theory of Inheritance, which identified chromosomes as the genetic material responsible for Mendelian inheritance.
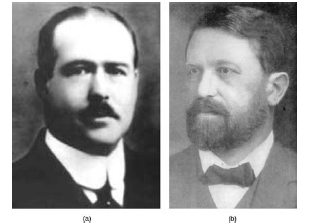
Figure 8.22 (a) Walter Sutton and (b) Theodor Boveri are credited with developing the Chromosomal Theory ofInheritance, which states that chromosomes carry the unit of heredity (genes).
- During meiosis, homologous chromosome pairs migrate as discrete structures that are independent of other chromosome pairs.
- The sorting of chromosomes from each homologous pair into pre-gametes appears to be random.
- Each parent synthesizes gametes that contain only half of their chromosomal complement.
- Even though male and female gametes (sperm and egg) differ in size and morphology, they have the same number of chromosomes, suggesting equal genetic contributions from each parent.
- The gametic chromosomes combine during fertilization to produce offspring with the same chromosome number as their parents.
Despite compelling correlations between the behavior of chromosomes during meiosis and Mendel’s abstract laws, the Chromosomal Theory of Inheritance was proposed long before there was any direct evidence that traits were carried on chromosomes. Critics pointed out that individuals had far more independently segregating traits than they had chromosomes. It was only after several years of carrying out crosses with the fruit fly, Drosophila melanogaster, that Thomas Hunt Morgan provided experimental evidence to support the Chromosomal Theory of Inheritance.
Homologous Recombination
In 1909, Frans Janssen observed chiasmata—the point at which chromatids are in contact with each other and may exchange segments—prior to the first division of meiosis. He suggested that alleles become unlinked and chromosomes physically exchange segments. As chromosomes condensed and paired with their homologs, they appeared to interact at distinct points. Janssen suggested that these points corresponded to regions in which chromosome segments were exchanged. It is now known that the pairing and interaction between homologous chromosomes, known as synapsis, does more than simply organize the homologs for migration to separate daughter cells. When synapsed, homologous chromosomes undergo reciprocal physical exchanges at their arms in a process called homologous recombination, or more simply, “crossing over.”
To better understand the type of experimental results that researchers were obtaining at this time, consider a heterozygous individual that inherited dominant maternal alleles for two genes on the same chromosome (such as AB) and two recessive paternal alleles for those same genes (such as ab). If the genes are linked, one would expect this individual to produce gametes that are either AB or ab with a 1:1 ratio. If the genes are unlinked, the individual should produce AB, Ab, aB, and ab gametes with equal frequencies, according to the Mendelian concept of independent assortment. Because they correspond to new allele combinations, the genotypes Ab and aB are nonparental types that result from homologous recombination during meiosis. Parental types are progeny that exhibit the same allelic combination as their parents. Morgan and his colleagues, however, found that when such heterozygous individuals were test crossed to a homozygous recessive parent (AaBb ~ aabb), both parental and nonparental cases occurred. For example, 950 offspring might be recovered that were either AaBb or aabb, but 50 offspring would also be obtained that were either Aabb or aaBb. These results suggested that linkage occurred most often, but a significant minority of offspring were the products of recombination.
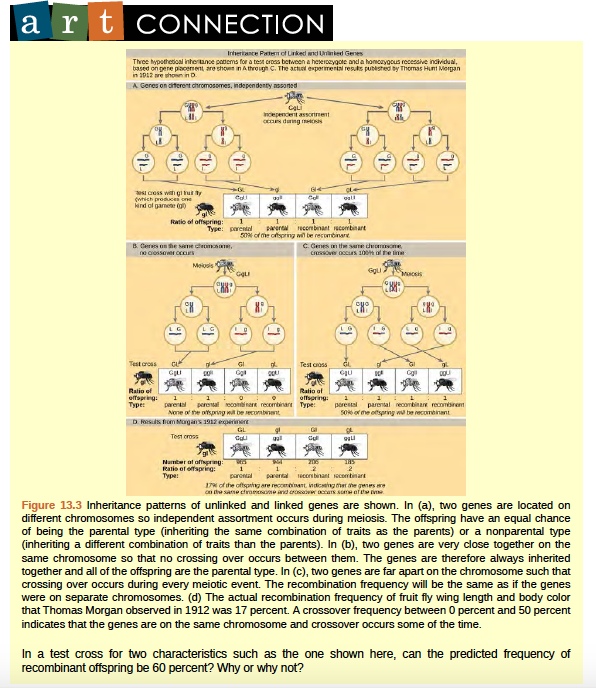
Figure 8.23 Inheritance patterns of unlinked and linked genes are shown.
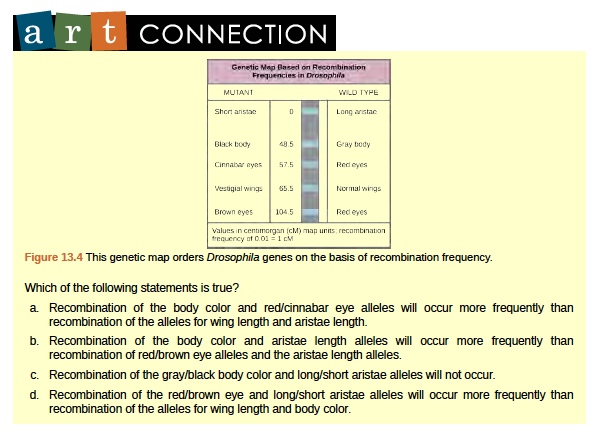
Figure 8.24 This genetic map orders Drosophila genes on the basis of recombination frequency.
In 1931, Barbara McClintock and Harriet Creighton demonstrated the crossover of homologous chromosomes in corn plants. Weeks later, homologous recombination in Drosophila was demonstrated microscopically by Curt Stern. Stern observed several X-linked phenotypes that were associated with a structurally unusual and dissimilar X chromosome pair in which one X was missing a small terminal segment, and the other X was fused to a piece of the Y chromosome. By crossing flies, observing their offspring, and then visualizing the offspring’s chromosomes, Stern demonstrated that every time the offspring allele combination deviated from either of the parental combinations, there was a corresponding exchange of an X chromosome segment. Using mutant flies with structurally distinct X chromosomes was the key to observing the products of recombination because DNA sequencing and other molecular tools were not yet available. It is now known that homologous chromosomes regularly exchange segments in meiosis by reciprocally breaking and rejoining their DNA at precise locations.
Review Sturtevant’s process to create a genetic map on the basis of recombination frequencies here (http://openstaxcollege.org/l/gene_crossover) .
Mendel’s Mapped Traits
Homologous recombination is a common genetic process, yet Mendel never observed it. Had he investigated both linked and unlinked genes, it would have been much more difficult for him to create a unified model of his data on the basis of probabilistic calculations. Researchers who have since mapped the seven traits investigated by Mendel onto the seven chromosomes of the pea plant genome have confirmed that all of the genes he examined are either on separate chromosomes or are sufficiently far apart as to be statistically unlinked. Some have suggested that Mendel was enormously lucky to select only unlinked genes, whereas others question whether Mendel discarded any data suggesting linkage. In any case, Mendel consistently observed independent assortment because he examined genes that were effectively unlinked.
8.5 | Chromosomal Basis of Inherited Disorders
Inherited disorders can arise when chromosomes behave abnormally during meiosis. Chromosome disorders can be divided into two categories: abnormalities in chromosome number and chromosomal structural rearrangements. Because even small segments of chromosomes can span many genes, chromosomal disorders are characteristically dramatic and often fatal.
Identification of Chromosomes
The isolation and microscopic observation of chromosomes forms the basis of cytogenetics and is the primary method by which clinicians detect chromosomal abnormalities in humans. A karyotype is the number and appearance of chromosomes, and includes their length, banding pattern, and centromere position. To obtain a view of an individual’s karyotype, cytologists photograph the chromosomes and then cut and paste each chromosome into a chart, or karyogram, also known as an ideogram (Figure 13.5).
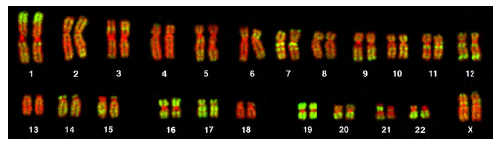
Figure 8.25 This karyotype is of a female human. Notice that homologous chromosomes are the same size, and have the same centromere positions and banding patterns. A human male would have an XY chromosome pair instead of the XX pair shown. (credit: Andreas Blozer et al)
In a given species, chromosomes can be identified by their number, size, centromere position, and banding pattern. In a human karyotype, autosomes or “body chromosomes” (all of the non–sex chromosomes) are generally organized in approximate order of size from largest (chromosome 1) to smallest (chromosome 22). The X and Y chromosomes are not autosomes. However, chromosome 21 is actually shorter than chromosome 22. This was discovered after the naming of Down syndrome as trisomy 21, reflecting how this disease results from possessing one extra chromosome 21 (three total). Not wanting to change the name of this important disease, chromosome 21 retained its numbering, despite describing the shortest set of chromosomes. The chromosome “arms” projecting from either end of the centromere may be designated as short or long, depending on their relative lengths. The short arm is abbreviated p (for “petite”), whereas the long arm is abbreviated q (because it follows “p” alphabetically). Each arm is further subdivided and denoted by a number. Using this naming system, locations on chromosomes can be described consistently in the scientific literature.
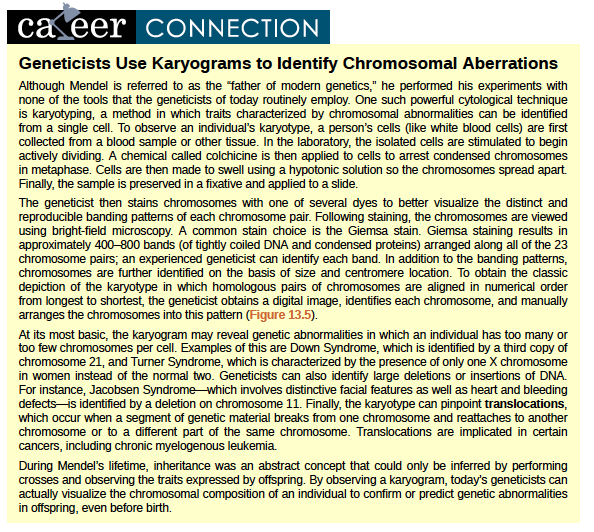
Geneticists Use Karyograms to Identify Chromosomal Aberrations
Although Mendel is referred to as the “father of modern genetics,” he performed his experiments with none of the tools that the geneticists of today routinely employ. One such powerful cytological technique is karyotyping, a method in which traits characterized by chromosomal abnormalities can be identified from a single cell. To observe an individual’s karyotype, a person’s cells (like white blood cells) are first collected from a blood sample or other tissue. In the laboratory, the isolated cells are stimulated to begin actively dividing. A chemical called colchicine is then applied to cells to arrest condensed chromosomes in metaphase. Cells are then made to swell using a hypotonic solution so the chromosomes spread apart. Finally, the sample is preserved in a fixative and applied to a slide.
The geneticist then stains chromosomes with one of several dyes to better visualize the distinct and reproducible banding patterns of each chromosome pair. Following staining, the chromosomes are viewed using bright-field microscopy. A common stain choice is the Giemsa stain. Giemsa staining results in approximately 400–800 bands (of tightly coiled DNA and condensed proteins) arranged along all of the 23 chromosome pairs; an experienced geneticist can identify each band. In addition to the banding patterns, chromosomes are further identified on the basis of size and centromere location. To obtain the classic depiction of the karyotype in which homologous pairs of chromosomes are aligned in numerical order from longest to shortest, the geneticist obtains a digital image, identifies each chromosome, and manually arranges the chromosomes into this pattern (Figure 12.25).
At its most basic, the karyogram may reveal genetic abnormalities in which an individual has too many or too few chromosomes per cell. Examples of this are Down Syndrome, which is identified by a third copy of chromosome 21, and Turner Syndrome, which is characterized by the presence of only one X chromosome in women instead of the normal two. Geneticists can also identify large deletions or insertions of DNA. For instance, Jacobsen Syndrome—which involves distinctive facial features as well as heart and bleeding defects—is identified by a deletion on chromosome 11. Finally, the karyotype can pinpoint translocations, which occur when a segment of genetic material breaks from one chromosome and reattaches to another chromosome or to a different part of the same chromosome. Translocations are implicated in certain cancers, including chronic myelogenous leukemia.
During Mendel’s lifetime, inheritance was an abstract concept that could only be inferred by performing crosses and observing the traits expressed by offspring. By observing a karyogram, today’s geneticists can actually visualize the chromosomal composition of an individual to confirm or predict genetic abnormalities in offspring, even before birth.
Disorders in Chromosome Number
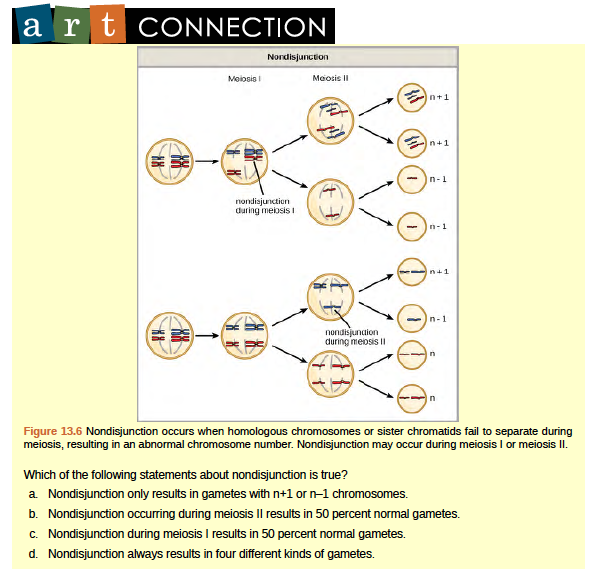
Of all of the chromosomal disorders, abnormalities in chromosome number are the most obviously identifiable from a karyogram. Disorders of chromosome number include the duplication or loss of entire chromosomes, as well as changes in the number of complete sets of chromosomes. They are caused by nondisjunction, which occurs when pairs of homologous chromosomes or sister chromatids fail to separate during meiosis. Misaligned or incomplete synapsis, or a dysfunction of the spindle apparatus that facilitates chromosome migration, can cause nondisjunction. The risk of nondisjunction occurring increases with the age of the parents.
Nondisjunction can occur during either meiosis I or II, with differing results (Figure 13.6). If homologous chromosomes fail to separate during meiosis I, the result is two gametes that lack that particular chromosome and two gametes with two copies of the chromosome. If sister chromatids fail to separate during meiosis II, the result is one gamete that lacks that chromosome, two normal gametes with one copy of the chromosome, and one gamete with two copies of the chromosome.
Aneuploidy
An individual with the appropriate number of chromosomes for their species is called euploid; in humans, euploidy corresponds to 22 pairs of autosomes and one pair of sex chromosomes. An individual with an error in chromosome number is described as aneuploid, a term that includes monosomy (loss of one chromosome) or trisomy (gain of an extraneous chromosome). Monosomic human zygotes missing any one copy of an autosome invariably fail to develop to birth because they lack essential genes. This underscores the importance of “gene dosage” in humans. Most autosomal trisomies also fail to develop to birth; however, duplications of some of the smaller chromosomes (13, 15, 18, 21, or 22) can result in offspring that survive for several weeks to many years. Trisomic individuals suffer from a different type of genetic imbalance: an excess in gene dose. Individuals with an extra chromosome may synthesize an abundance of the gene products encoded by that chromosome. This extra dose (150 percent) of specific genes can lead to a number of functional challenges and often precludes development. The most common trisomy among viable births is that of chromosome 21, which corresponds to Down Syndrome. Individuals with this inherited disorder are characterized by short stature and stunted digits, facial distinctions that include a broad skull and large tongue, and significant developmental delays. The incidence of Down syndrome is correlated with maternal age; older women are more likely to become pregnant with fetuses carrying the trisomy 21 genotype (Figure 8.27).
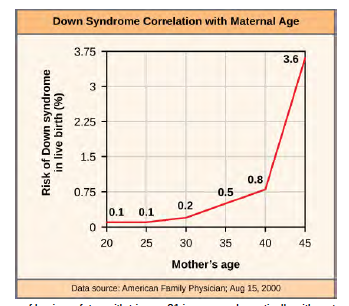
Figure 8.27 The incidence of having a fetus with trisomy 21 increases dramatically with maternal age. Visualize the addition of a chromosome that leads to Down syndrome in this video simulation (http://openstaxcollege.org/l/down_syndrome) .
Polyploidy
An individual with more than the correct number of chromosome sets (two for diploid species) is called polyploid. For instance, fertilization of an abnormal diploid egg with a normal haploid sperm would yield a triploid zygote. Polyploid animals are extremely rare, with only a few examples among the flatworms, crustaceans, amphibians, fish, and lizards.
Polyploid animals are sterile because meiosis cannot proceed normally and instead produces mostly aneuploid daughter cells that cannot yield viable zygotes. Rarely, polyploid animals can reproduce asexually by haplodiploidy, in which an unfertilized egg divides mitotically to produce offspring. In contrast, polyploidy is very common in the plant kingdom, and polyploid plants tend to be larger and more robust than euploids of their species (Figure 8.28).
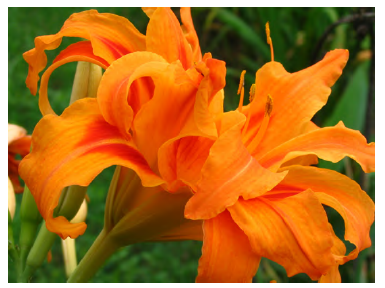
Figure 8.28 As with many polyploid plants, this triploid orange daylily (Hemerocallis fulva) is particularly large and robust, and grows flowers with triple the number of petals of its diploid counterparts. (credit: Steve Karg)
Sex Chromosome Nondisjunction in Humans
Humans display dramatic deleterious effects with autosomal trisomies and monosomies. Therefore, it may seem counterintuitive that human females and males can function normally, despite carrying different numbers of the X chromosome. Rather than a gain or loss of autosomes, variations in the number of sex chromosomes are associated with relatively mild effects. In part, this occurs because of a molecular process called X inactivation. Early in development, when female mammalian embryos consist of just a few thousand cells (relative to trillions in the newborn), one X chromosome in each cell inactivates by tightly condensing into a quiescent (dormant) structure called a Barr body. The chance that an X chromosome (maternally or paternally derived) is inactivated in each cell is random, but once the inactivation occurs, all cells derived from that one will have the same inactive X chromosome or Barr body. By this process, females compensate for their double genetic dose of X chromosome. In so-called “tortoiseshell” cats, embryonic X inactivation is observed as color variegation (Figure 13.9). Females that are heterozygous for an X-linked coat color gene will express one of two different coat colors over different regions of their body, corresponding to whichever X chromosome is inactivated in the embryonic cell progenitor of that region.
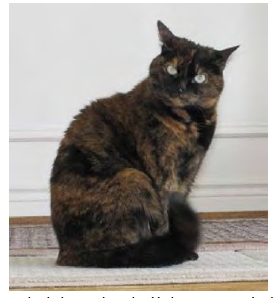
Figure 8.29 In cats, the gene for coat color is located on the X chromosome. In the embryonic development of female cats, one of the two X chromosomes is randomly inactivated in each cell, resulting in a tortoiseshell pattern if the cat has two different alleles for coat color. Male cats, having only one X chromosome, never exhibit a tortoiseshell coat color. (credit: Michael Bodega)
An individual carrying an abnormal number of X chromosomes will inactivate all but one X chromosome in each of her cells. However, even inactivated X chromosomes continue to express a few genes, and X chromosomes must reactivate for the proper maturation of female ovaries. As a result, X-chromosomal abnormalities are typically associated with mild mental and physical defects, as well as sterility. If the X chromosome is absent altogether, the individual will not develop in utero.
Several errors in sex chromosome number have been characterized. Individuals with three X chromosomes, called triplo- X, are phenotypically female but express developmental delays and reduced fertility. The XXY genotype, corresponding to one type of Klinefelter syndrome, corresponds to phenotypically male individuals with small testes, enlarged breasts, and reduced body hair. More complex types of Klinefelter syndrome exist in which the individual has as many as five X chromosomes. In all types, every X chromosome except one undergoes inactivation to compensate for the excess genetic dosage. This can be seen as several Barr bodies in each cell nucleus. Turner syndrome, characterized as an X0 genotype (i.e., only a single sex chromosome), corresponds to a phenotypically female individual with short stature, webbed skin in the neck region, hearing and cardiac impairments, and sterility.
Duplications and Deletions
In addition to the loss or gain of an entire chromosome, a chromosomal segment may be duplicated or lost. Duplications and deletions often produce offspring that survive but exhibit physical and mental abnormalities. Duplicated chromosomal segments may fuse to existing chromosomes or may be free in the nucleus. Cri-du-chat (from the French for “cry of the cat”) is a syndrome associated with nervous system abnormalities and identifiable physical features that result from a deletion of most of 5p (the small arm of chromosome 5) (Figure 8.30). Infants with this genotype emit a characteristic high-pitched cry on which the disorder’s name is based.
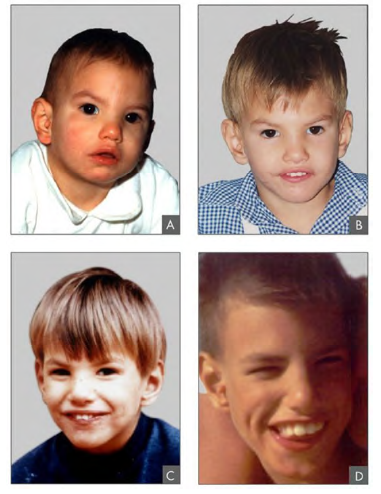
Figure 8.30 This individual with cri-du-chat syndrome is shown at two, four, nine, and 12 years of age. (credit: Paola Cerruti Mainardi)
Chromosomal Structural Rearrangements
Cytologists have characterized numerous structural rearrangements in chromosomes, but chromosome inversions and translocations are the most common. Both are identified during meiosis by the adaptive pairing of rearranged chromosomes with their former homologs to maintain appropriate gene alignment. If the genes carried on two homologs are not oriented correctly, a recombination event could result in the loss of genes from one chromosome and the gain of genes on the other. This would produce aneuploid gametes.
Chromosome Inversions
A chromosome inversion is the detachment, 180Åã rotation, and reinsertion of part of a chromosome. Inversions may occur
in nature as a result of mechanical shear, or from the action of transposable elements (special DNA sequences capable of facilitating the rearrangement of chromosome segments with the help of enzymes that cut and paste DNA sequences). Unless they disrupt a gene sequence, inversions only change the orientation of genes and are likely to have more mild effects than aneuploid errors. However, altered gene orientation can result in functional changes because regulators of gene expression could be moved out of position with respect to their targets, causing aberrant levels of gene products. An inversion can be pericentric and include the centromere, or paracentric and occur outside of the centromere (Figure 8.31). A pericentric inversion that is asymmetric about the centromere can change the relative lengths of the chromosome arms, making these inversions easily identifiable.
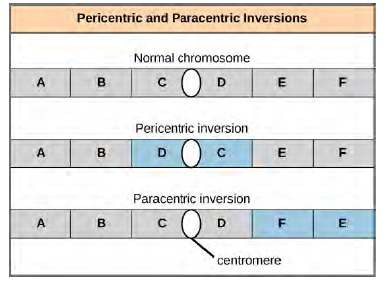
Figure 8.31 Pericentric inversions include the centromere, and paracentric inversions do not. A pericentric inversion can change the relative lengths of the chromosome arms; a paracentric inversion cannot. When one homologous chromosome undergoes an inversion but the other does not, the individual is described as an inversion heterozygote. To maintain point-for-point synapsis during meiosis, one homolog must form a loop, and the other homolog must mold around it. Although this topology can ensure that the genes are correctly aligned, it also forces the homologs to stretch and can be associated with regions of imprecise synapsis (Figure 12.32).
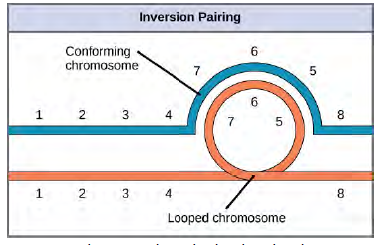
Figure 8.32 When one chromosome undergoes an inversion but the other does not, one chromosome must form an inverted loop to retain point-for-point interaction during synapsis. This inversion pairing is essential to maintaining gene alignment during meiosis and to allow for recombination.
The Chromosome 18 Inversion
Not all structural rearrangements of chromosomes produce nonviable, impaired, or infertile individuals. In rare instances, such a change can result in the evolution of a new species. In fact, a pericentric inversion in chromosome 18 appears to have contributed to the evolution of humans. This inversion is not present in our closest genetic relatives, the chimpanzees. Humans and chimpanzees differ cytogenetically by pericentric inversions on several chromosomes and by the fusion of two separate chromosomes in chimpanzees that correspond to chromosome two in humans.
The pericentric chromosome 18 inversion is believed to have occurred in early humans following their divergence from a common ancestor with chimpanzees approximately five million years ago. Researchers characterizing this inversion have suggested that approximately 19,000 nucleotide bases were duplicated on 18p, and the duplicated region inverted and reinserted on chromosome 18 of an ancestral human. A comparison of human and chimpanzee genes in the region of this inversion indicates that two genes—ROCK1 and USP14—that are adjacent on chimpanzee chromosome 17 (which corresponds to human chromosome 18) are more distantly positioned on human chromosome 18. This suggests that one of the inversion breakpoints occurred between these two genes. Interestingly, humans and chimpanzees express USP14 at distinct levels in specific cell types, including cortical cells and fibroblasts. Perhaps the chromosome 18 inversion in an ancestral human repositioned specific genes and reset their expression levels in a useful way. Because both ROCK1 and USP14 encode cellular enzymes, a change in their expression could alter cellular function. It is not known how this inversion contributed to hominid evolution, but it appears to be a significant factor in the divergence of humans from other primates.
Translocations
A translocation occurs when a segment of a chromosome dissociates and reattaches to a different, non-homologous chromosome. Translocations can be benign or have devastating effects depending on how the positions of genes are altered with respect to regulatory sequences. Notably, specific translocations have been associated with several cancers and with schizophrenia. Reciprocal translocations result from the exchange of chromosome segments between two non-homologous chromosomes such that there is no gain or loss of genetic information (Figure 8.33).
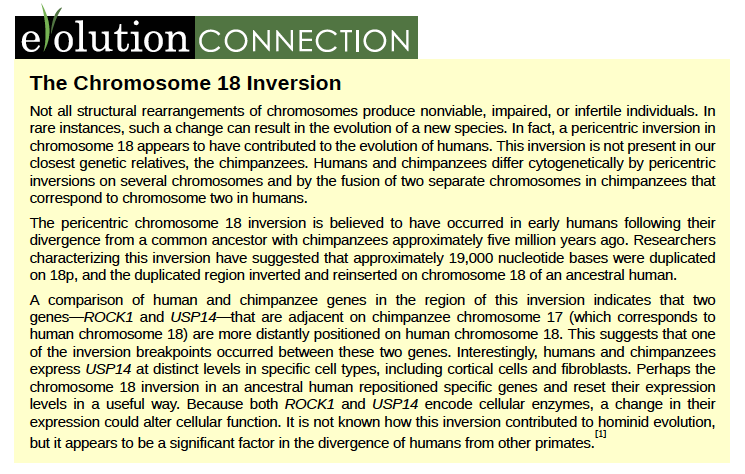
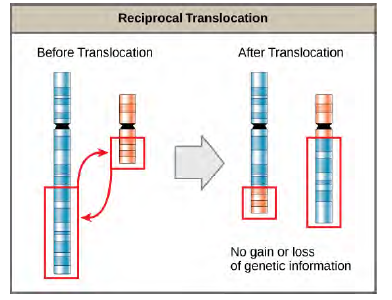
Figure 8.33 A reciprocal translocation occurs when a segment of DNA is transferred from one chromosome to another, nonhomologous chromosome. (credit: modification of work by National Human Genome Research/USA)
- Violaine Goidts et al., “Segmental duplication associated with the human-specific inversion of chromosome 18: a further example of the impact of segmental duplications on karyotype and genome evolution in primates,” Human Genetics. 115 (2004):116-122
KEY TERMS
allele gene variations that arise by mutation and exist at the same relative locations on homologous chromosomes
autosomes any of the non-sex chromosomes
codominance in a heterozygote, complete and simultaneous expression of both alleles for the same characteristic
continuous variation inheritance pattern in which a character shows a range of trait values with small gradations rather than large gaps between them
dihybrid result of a cross between two true-breeding parents that express different traits for two characteristics
dominant trait which confers the same physical appearance whether an individual has two copies of the trait or one copy of the dominant trait and one copy of the recessive trait
dominant lethal inheritance pattern in which an allele is lethal both in the homozygote and the heterozygote; this allele can only be transmitted if the lethality phenotype occurs after reproductive age
epistasis antagonistic interaction between genes such that one gene masks or interferes with the expression of another
genotype underlying genetic makeup, consisting of both physically visible and non-expressed alleles, of an organism
hemizygous presence of only one allele for a characteristic, as in X-linkage; hemizygosity makes descriptions of dominance and recessiveness irrelevant
heterozygous having two different alleles for a given gene on the homologous chromosome
homozygous having two identical alleles for a given gene on the homologous chromosome
hybridization process of mating two individuals that differ with the goal of achieving a certain characteristic in their offspring
incomplete dominance in a heterozygote, expression of two contrasting alleles such that the individual displays an intermediate phenotype
law of dominance in a heterozygote, one trait will conceal the presence of another trait for the same characteristic
law of independent assortment genes do not influence each other with regard to sorting of alleles into gametes; every possible combination of alleles is equally likely to occur
law of segregation paired unit factors (i.e., genes) segregate equally into gametes such that offspring have an equal likelihood of inheriting any combination of factors
linkage phenomenon in which alleles that are located in close proximity to each other on the same chromosome are more likely to be inherited together
monohybrid result of a cross between two true-breeding parents that express different traits for only one characteristic parental generation in a cross
phenotype observable traits expressed by an organism
recessive trait that appears “latent” or non-expressed when the individual also carries a dominant trait for that same
recessive lethal characteristic; when present as two identical copies, the recessive trait is expressed
sex-linked any gene on a sex chromosome
trait variation in the physical appearance of a heritable characteristic
X-linked gene present on the X, but not the Y chromosome
CHAPTER SUMMARY
8.1 Mendel’s Experiments and the Laws of Probability
Working with garden pea plants, Mendel found that crosses between parents that differed by one trait produced F1 offspring that all expressed the traits of one parent. Observable traits are referred to as dominant, and non-expressed traits are described as recessive. When the offspring in Mendel’s experiment were self-crossed, the F2 offspring exhibited the dominant trait or the recessive trait in a 3:1 ratio, confirming that the recessive trait had been transmitted faithfully from the original P0 parent. Reciprocal crosses generated identical F1 and F2 offspring ratios. By examining sample sizes, Mendel showed that his crosses behaved reproducibly according to the laws of probability, and that the traits were inherited as independent events.
8.2 Characteristics and Traits
When true-breeding or homozygous individuals that differ for a certain trait are crossed, all of the offspring will be heterozygotes for that trait. If the traits are inherited as dominant and recessive, the F1 offspring will all exhibit the same phenotype as the parent homozygous for the dominant trait. If these heterozygous offspring are self-crossed, the resulting F2 offspring will be equally likely to inherit gametes carrying the dominant or recessive trait, giving rise to offspring of which one quarter are homozygous dominant, half are heterozygous, and one quarter are homozygous recessive. Because homozygous dominant and heterozygous individuals are phenotypically identical, the observed traits in the F2 offspring will exhibit a ratio of three dominant to one recessive. Alleles do not always behave in dominant and recessive patterns. Incomplete dominance describes situations in which the heterozygote exhibits a phenotype that is intermediate between the homozygous phenotypes. Codominance describes the simultaneous expression of both of the alleles in the heterozygote. Although diploid organisms can only have two alleles for any given gene, it is common for more than two alleles of a gene to exist in a population. In humans, as in many animals and some plants, females have two X chromosomes and males have one X and one Y chromosome. Genes that are present on the X but not the Y chromosome are said to be X-linked, such that males only inherit one allele for the gene, and females inherit two. Finally, some alleles can be lethal. Recessive lethal alleles are only lethal in homozygotes, but dominant lethal alleles are fatal in heterozygotes as well.
8.3 Laws of Inheritance
Mendel postulated that genes (characteristics) are inherited as pairs of alleles (traits) that behave in a dominant and recessive pattern. Alleles segregate into gametes such that each gamete is equally likely to receive either one of the two alleles present in a diploid individual. In addition, genes are assorted into gametes independently of one another. That is, alleles are generally not more likely to segregate into a gamete with a particular allele of another gene. A dihybrid cross demonstrates independent assortment when the genes in question are on different chromosomes or distant from each other on the same chromosome. For crosses involving more than two genes, use the forked line or probability methods to predict offspring genotypes and phenotypes rather than a Punnett square.
Although chromosomes sort independently into gametes during meiosis, Mendel’s law of independent assortment refers to genes, not chromosomes, and a single chromosome may carry more than 1,000 genes. When genes are located in close proximity on the same chromosome, their alleles tend to be inherited together. This results in offspring ratios that violate Mendel’s law of independent assortment. However, recombination serves to exchange genetic material on homologous chromosomes such that maternal and paternal alleles may be recombined on the same chromosome. This is why alleles on a given chromosome are not always inherited together. Recombination is a random event occurring anywhere on a chromosome. Therefore, genes that are far apart on the same chromosome are likely to still assort independently because of recombination events that occurred in the intervening chromosomal space.
Whether or not they are sorting independently, genes may interact at the level of gene products such that the expression of an allele for one gene masks or modifies the expression of an allele for a different gene. This is called epistasis.
REVIEW QUESTIONS
Mendel performed hybridizations by transferring pollen
from the _______ of the male plant to the female ova.
a. anther
b. pistil
c. stigma
d. seed
Which is one of the seven characteristics that Mendel
observed in pea plants?
a. flower size
b. seed texture
c. leaf shape
d. stem color
Imagine you are performing a cross involving seed
color in garden pea plants. What F1 offspring would you
expect if you cross true-breeding parents with green seeds
and yellow seeds? Yellow seed color is dominant over
green.
a. 100 percent yellow-green seeds
b. 100 percent yellow seeds
c. 50 percent yellow, 50 percent green seeds
d. 25 percent green, 75 percent yellow seeds
Consider a cross to investigate the pea pod texture trait,
involving constricted or inflated pods. Mendel found that
the traits behave according to a dominant/recessive pattern
in which inflated pods were dominant. If you performed
this cross and obtained 650 inflated-pod plants in the F2
generation, approximately how many constricted-pod
plants would you expect to have?
a. 600
b. 165
c. 217
d. 468
The observable traits expressed by an organism are
described as its ________.
a. phenotype
b. genotype
c. alleles
d. zygote
A recessive trait will be observed in individuals that
are ________ for that trait.
a. heterozygous
b. homozygous or heterozygous
c. homozygous
d. diploid
If black and white true-breeding mice are mated and
the result is all gray offspring, what inheritance pattern
would this be indicative of?
a. dominance
b. codominance
c. multiple alleles
d. incomplete dominance
The ABO blood groups in humans are expressed as
the IA, IB, and i alleles. The IA allele encodes the A blood
group antigen, IB encodes B, and i encodes O. Both A and
B are dominant to O. If a heterozygous blood type A
parent (IAi) and a heterozygous blood type B parent (IBi)
mate, one quarter of their offspring will have AB blood
type (IAIB) in which both antigens are expressed equally.
Therefore, ABO blood groups are an example of:
a. multiple alleles and incomplete dominance
b. codominance and incomplete dominance
c. incomplete dominance only
d. multiple alleles and codominance
In a mating between two individuals that are
heterozygous for a recessive lethal allele that is expressed
in utero, what genotypic ratio (homozygous
dominant:heterozygous:homozygous recessive) would you
expect to observe in the offspring?
a. 1:2:1
b. 3:1:1
c. 1:2:0
d. 0:2:1
X-linked recessive traits in humans (or in Drosophila)
are observed ________.
a. in more males than females
b. in more females than males
c. in males and females equally
d. in different distributions depending on the trait
The first suggestion that chromosomes may physically
exchange segments came from the microscopic
identification of ________.
a. synapsis
b. sister chromatids
c. chiasmata
d. alleles
Which recombination frequency corresponds to
independent assortment and the absence of linkage?
a. 0
b. 0.25
c. 0.50
d. 0.75
Which recombination frequency corresponds to perfect
linkage and violates the law of independent assortment?
a. 0
b. 0.25
c. 0.50
d. 0.75
Which of the following codes describes position 12 on
the long arm of chromosome 13?
a. 13p12
b. 13q12
c. 12p13
d. 12q13
In agriculture, polyploid crops (like coffee,
strawberries, or bananas) tend to produce ________.
a. more uniformity
b. more variety
c. larger yields
d. smaller yields
Assume a pericentric inversion occurred in one of two
homologs prior to meiosis. The other homolog remains
normal. During meiosis, what structure—if any—would
these homologs assume in order to pair accurately along
their lengths?
a. V formation
b. cruciform
c. loop
d. pairing would not be possible
8. The genotype XXY corresponds to
a. Klinefelter syndrome
b. Turner syndrome
c. Triplo-X
d. Jacob syndrome
Abnormalities in the number of X chromosomes tends to have milder phenotypic effects than the same abnormalities in autosomes because of ________.
a. deletions
b. nonhomologous recombination
c. synapsis
d. X inactivation
By definition, a pericentric inversion includes the ________.
a. centromere
b. chiasma
c. telomere
d. synapse
CRITICAL THINKING QUESTIONS
Describe one of the reasons why the garden pea was an excellent choice of model system for studying inheritance.
How would you perform a reciprocal cross for the characteristic of stem height in the garden pea?
The gene for flower position in pea plants exists as axial or terminal alleles. Given that axial is dominant to terminal, list all of the possible F1 and F2 genotypes and phenotypes from a cross involving parents that are homozygous for each trait. Express genotypes with conventional genetic abbreviations.
Use a Punnett square to predict the offspring in a cross between a dwarf pea plant (homozygous recessive) and a tall pea plant (heterozygous). What is the phenotypic ratio of the offspring?
Can a human male be a carrier of red-green color blindness?
Explain epistatis in terms of its Greek-language roots “standing upon.”
Adapted from:
OpenStax, Biology. OpenStax. May 20, 2013. <http://cnx.org/content/col11448/latest/>
“Download for free at http://cnx.org/content/col11448/latest/.”
