
11 Chapter 11: Ecosystems
Chapter Outline
11.1 Ecology of Ecosystems
11.2 Energy Flow through Ecosystems
11.3 Biogeochemical Cycles
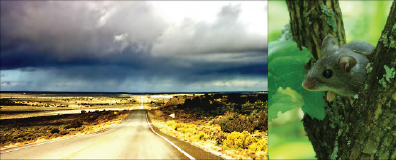
Figure 11.1 In the southwestern United States, rainy weather causes an increase in production of pinyon nuts, causing the deer mouse population to explode. Deer mice may carry a virus called Sin Nombre (a hantavirus) that causes respiratory disease in humans and has a high fatality rate. In 1992–1993, wet El Nino weather caused a Sin Nombre epidemic. Navajo healers, who were aware of the link between this disease and weather, predicted the outbreak.(credit “highway”: modification of work by Phillip Capper; credit “mouse”: modification of work by USFWS)Chapter Outline
Introduction
In 1993, an interesting example of ecosystem dynamics occurred when a rare lung disease struck inhabitants of the southwestern United States. This disease had an alarming rate of fatalities, killing more than half of early patients, many of whom were Native Americans. These formerly healthy young adults died from complete respiratory failure. The disease was unknown, and the Centers for Disease Control (CDC), the United States government agency responsible for managing potential epidemics, was brought in to investigate. The scientists could have learned about the disease had they known to talk with the Navajo healers who lived in the area and who had observed the connection between rainfall and mice populations, thereby predicting the 1993 outbreak.The cause of the disease, determined within a few weeks by the CDC investigators, was the hantavirus known as Sin Nombre, the virus with “no name.” With insights from traditional Navajo medicine, scientists were able to characterize the disease rapidly and institute effective health measures to prevent its spread. This example illustrates the importance of understanding the complexities of ecosystems and how they respond to changes in the environment.
11.1 | Ecology of Ecosystems
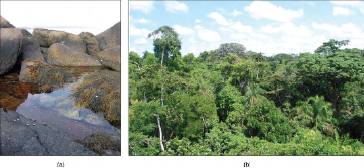
Life in an ecosystem is often about competition for limited resources, a characteristic of the theory of natural selection.Competition in communities (all living things within specific habitats) is observed both within species and among different species. The resources for which organisms compete include organic material from living or previously living organisms, sunlight, and mineral nutrients, which provide the energy for living processes and the matter to make up organisms’ physical structures. Other critical factors influencing community dynamics are the components of its physical and geographic environment: a habitat’s latitude, amount of rainfall, topography (elevation), and available species. These are all important environmental variables that determine which organisms can exist within a particular area.An ecosystem is a community of living organisms and their interactions with their abiotic (non-living) environment.Ecosystems can be small, such as the tide pools found near the rocky shores of many oceans, or large, such as the AmazonRainforest in Brazil (Figure 11.2).
There are three broad categories of ecosystems based on their general environment: freshwater, ocean water, and terrestrial.Within these broad categories are individual ecosystem types based on the organisms present and the type of environmental habitat. Ocean ecosystems are the most common, comprising 75 percent of the Earth’s surface and consisting of three basic types:shallow ocean, deep ocean water, and deep ocean surfaces (the low depth areas of the deep oceans). The shallow ocean ecosystems include extremely biodiverse coral reef ecosystems, and the deep ocean surface is known for its large numbers of plankton and krill (small crustaceans) that support it. These two environments are especially important to aerobic respirators worldwide as the phytoplankton perform 40 percent of all photosynthesis on Earth. Although not as diverse as the other two, deep ocean ecosystems contain a wide variety of marine organisms. Such ecosystems exist even at the bottom of the ocean where light is unable to penetrate through the water.Freshwater ecosystems are the rarest, occurring on only 1.8 percent of the Earth’s surface. Lakes, rivers, streams, and springs comprise these systems; they are quite diverse, and they support a variety of fish, amphibians, reptiles, insects, phytoplankton, fungi, and bacteria.Terrestrial ecosystems, also known for their diversity, are grouped into large categories called biomes, such as tropical rain forests, savannas, deserts, coniferous forests, deciduous forests, and tundra. Grouping these ecosystems into just a few biome categories obscures the great diversity of the individual ecosystems within them. For example, there is great variation in desert vegetation: the saguaro cacti and other plant life in the Sonoran Desert, in the United States, are relatively abundant compared to the desolate rocky desert of Boa Vista, an island off the coast of Western Africa (Figure 11.3).
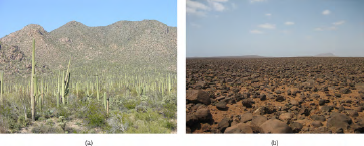
Figure 11.3 Desert ecosystems, like all ecosystems, can vary greatly. The desert in (a) Saguaro National Park,Arizona, has abundant plant life, while the rocky desert of (b) Boa Vista island, Cape Verde, Africa, is devoid of plant life. (credit a: modification of work by Jay Galvin; credit b: modification of work by Ingo W.lbern)
Ecosystems are complex with many interacting parts. They are routinely exposed to various disturbances, or changes in the environment that effect their compositions: yearly variations in rainfall and temperature and the slower processes of plant growth, which may take several years. Many of these disturbances are a result of natural processes. For example, when lightning causes a forest fire and destroys part of a forest ecosystem, the ground is eventually populated by grasses, then by bushes and shrubs, and later by mature trees, restoring the forest to its former state. The impact of environmental disturbances caused by human activities is as important as the changes wrought by natural processes. Human agricultural practices, air pollution, acid rain, global deforestation, overfishing, eutrophication, oil spills, and illegal dumping on land and into the ocean are all issues of concern to conservationists.Equilibrium is the steady state of an ecosystem where all organisms are in balance with their environment and with each other. In ecology, two parameters are used to measure changes in ecosystems: resistance and resilience. The ability of an ecosystem to remain at equilibrium in spite of disturbances is called resistance. The speed at which an ecosystem recovers equilibrium after being disturbed, called its resilience. Ecosystem resistance and resilience are especially important when considering human impact. The nature of an ecosystem may change to such a degree that it can lose its resilience entirely.This process can lead to the complete destruction or irreversible altering of the ecosystem.
Food Chains and Food Webs
The term “food chain” is sometimes used metaphorically to describe human social situations. In this sense, food chains are thought of as a competition for survival, such as “who eats whom?” Someone eats and someone is eaten. Therefore, it is not surprising that in our competitive “dog-eat-dog” society, individuals who are considered successful are seen as being at the top of the food chain, consuming all others for their benefit, whereas the less successful are seen as being at the bottom.The scientific understanding of a food chain is more precise than in its everyday usage. In ecology, a food chain is a linear sequence of organisms through which nutrients and energy pass: primary producers, primary consumers, and higher-level consumers are used to describe ecosystem structure and dynamics. There is a single path through the chain. Each organism in a food chain occupies what is called a trophic level. Depending on their role as producers or consumers, species or groups of species can be assigned to various trophic levels.In many ecosystems, the bottom of the food chain consists of photosynthetic organisms (plants and/or phytoplankton),which are called primary producers. The organisms that consume the primary producers are herbivores: the primary consumers. Secondary consumers are usually carnivores that eat the primary consumers. Tertiary consumers are carnivores that eat other carnivores. Higher-level consumers feed on the next lower tropic levels, and so on, up to the organisms at the top of the food chain: the apex consumers. In the Lake Ontario food chain shown in Figure 11.4, the Chinook salmon is the apex consumer at the top of this food chain.
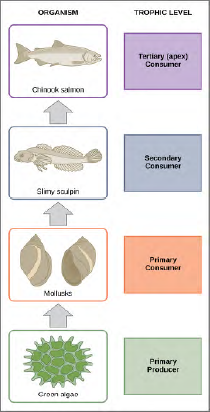
Figure 11.4 These are the trophic levels of a food chain in Lake Ontario at the United States-Canada border. Energy and nutrients flow from photosynthetic green algae at the bottom to the top of the food chain: the Chinook salmon.
One major factor that limits the length of food chains is energy. Energy is lost as heat between each trophic level due to the second law of thermodynamics. Thus, after a limited number of trophic energy transfers, the amount of energy remaining in the food chain may not be great enough to support viable populations at yet a higher trophic level. The loss of energy between trophic levels is illustrated by the pioneering studies of Howard T. Odum in the Silver Springs,Florida, ecosystem in the 1940s (Figure 11.5). The primary producers generated 20,819 kcal/m2/yr (kilocalories per square meter per year), the primary consumers generated 3368 kcal/m2/yr, the secondary consumers generated 383 kcal/m2/yr, and the tertiary consumers only generated 21 kcal/m2/yr. Thus, there is little energy remaining for another level of consumers in this ecosystem.
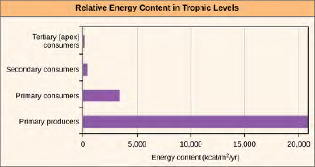
Figure 11.5 The relative energy in trophic levels in a Silver Springs, Florida, ecosystem is shown. Each trophic level has less energy available and supports fewer organisms at the next level.
There is a one problem when using food chains to accurately describe most ecosystems. Even when all organisms are grouped into appropriate trophic levels, some of these organisms can feed on species from more than one trophic level; likewise, some of these organisms can be eaten by species from multiple trophic levels. In other words, the linear model of ecosystems, the food chain, is not completely descriptive of ecosystem structure. A holistic model—which accounts for all the interactions between different species and their complex interconnected relationships with each other and with the environment—is a more accurate and descriptive model for ecosystems. A food web is a graphic representation of a holistic, non-linear web of primary producers, primary consumers, and higher-level consumers used to describe ecosystem structure and dynamics (Figure 11.6).
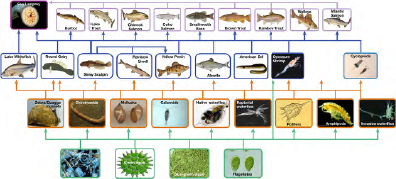
Figure 11.6 This food web shows the interactions between organisms across trophic levels in the Lake Ontario ecosystem. Primary producers are outlined in green, primary consumers in orange, secondary consumers in blue, and tertiary (apex) consumers in purple. Arrows point from an organism that is consumed to the organism that consumes it. Notice how some lines point to more than one trophic level. For example, the opossum shrimp eats both primary producers and primary consumers. (credit: NOAA, GLERL)A comparison of the two types of structural ecosystem models shows strength in both. Food chains are more flexible for analytical modeling, are easier to follow, and are easier to experiment with, whereas food web models more accurately represent ecosystem structure and dynamics, and data can be directly used as input for simulation modeling.
Head to this online interactive simulator (http://openstaxcollege.org/l/food_web) to investigate food web function. In the Interactive Labs box, under Food Web, click Step 1. Read the instructions first, and then click Step 2 for additional instructions. When you are ready to create a simulation, in the upper-right corner of the Interactive Labs box, click OPEN SIMULATOR. Two general types of food webs are often shown interacting within a single ecosystem.
A grazing food web (such as theLake Ontario food web in Figure 11.6) has plants or other photosynthetic organisms at its base, followed by herbivores and various carnivores. A detrital food web consists of a base of organisms that feed on decaying organic matter (dead organisms), called decomposers or detritivores. These organisms are usually bacteria or fungi that recycle organic material back into the biotic part of the ecosystem as they themselves are consumed by other organisms. As all ecosystems require a method to recycle material from dead organisms, most grazing food webs have an associated detrital food web. For example, in a meadow ecosystem, plants may support a grazing food web of different organisms, primary and other levels of consumers, while at the same time supporting a detrital food web of bacteria, fungi, and detrivorous invertebrates feeding off dead plants and animals.1372
Research into Ecosystem Dynamics: Ecosystem Experimentation andModelingThe study of the changes in ecosystem structure caused by changes in the environment (disturbances) or by internal forces is called ecosystem dynamics. Ecosystems are characterized using a variety of research methodologies. Some ecologists. Nature (Vol. 458, April 1, 2009)
Some ecologists study ecosystems using controlled experimental systems, while some study entire ecosystems in their natural state, and others use both approaches.A holistic ecosystem model attempts to quantify the composition, interaction, and dynamics of entire ecosystems; it is the most representative of the ecosystem in its natural state. A food web is an example of a holistic ecosystem model. However, this type of study is limited by time and expense, as well as the fact that it is neither feasible nor ethical to do experiments on large natural ecosystems. To quantify all different species in an ecosystem and the dynamics in their habitat is difficult, especially when studying large habitats such as the Amazon Rainforest, which covers 1.4 billion acres (5.5 million km2) of the Earth’s surface.For these reasons, scientists study ecosystems under more controlled conditions. Experimental systems usually involve either partitioning a part of a natural ecosystem that can be used for experiments, termed a mesocosm, or by re-creating an ecosystem entirely in an indoor or outdoor laboratory environment, which is referred to as a microcosm. A major limitation to these approaches is that removing individual organisms from their natural ecosystem or altering a natural ecosystem through partitioning may change the dynamics of the ecosystem. These changes are often due to differences in species numbers and diversity and also to environment alterations caused by partitioning (mesocosm) or re-creating (microcosm)the natural habitat. Thus, these types of experiments are not totally predictive of changes that would occur in the ecosystem from which they were gathered.As both of these approaches have their limitations, some ecologists suggest that results from these experimental systems should be used only in conjunction with holistic ecosystem studies to obtain the most representative data about ecosystem structure, function, and dynamics.Scientists use the data generated by these experimental studies to develop ecosystem models that demonstrate the structure and dynamics of ecosystems. Three basic types of ecosystem modeling are routinely used in research and ecosystem management: a conceptual model, an analytical model, and a simulation model. A conceptual model is an ecosystem model that consists of flow charts to show interactions of different compartments of the living and nonliving components of the ecosystem. A conceptual model describes ecosystem structure and dynamics and shows how environmental disturbances affect the ecosystem; however, its ability to predict the effects of these disturbances is limited. Analytical and simulation models, in contrast, are mathematical methods of describing ecosystems that are indeed capable of predicting the effects of potential environmental changes without direct experimentation, although with some limitations as to accuracy. An analytical model is an ecosystem model that is created using simple mathematical formulas to predict the effects of environmental disturbances on ecosystem structure and dynamics. A simulation model is an ecosystem model that is created using complex computer algorithms to holistically model ecosystems and to predict the effects of environmental disturbances on ecosystem structure and dynamics. Ideally, these models are accurate enough to determine which components of the ecosystem are particularly sensitive to disturbances, and they can serve as a guide to ecosystem managers(such as conservation ecologists or fisheries biologists) in the practical maintenance of ecosystem health.Conceptual ModelsConceptual models are useful for describing ecosystem structure and dynamics and for demonstrating the relationships between different organisms in a community and their environment. Conceptual models are usually depicted graphically as flow charts. The organisms and their resources are grouped into specific compartments with arrows showing the relationship and transfer of energy or nutrients between them. Thus, these diagrams are sometimes called compartment models.
To model the cycling of mineral nutrients, organic and inorganic nutrients are subdivided into those that are bioavailable(ready to be incorporated into biological macromolecules) and those that are not. For example, in a terrestrial ecosystem near a deposit of coal, carbon will be available to the plants of this ecosystem as carbon dioxide gas in a short-term period, not from the carbon-rich coal itself. However, over a longer period, microorganisms capable of digesting coal will incorporate its carbon or release it as natural gas (methane, CH4), changing this unavailable organic source into an available one. This conversion is greatly accelerated by the combustion of fossil fuels by humans, which releases large amounts of carbon dioxide into the atmosphere. This is thought to be a major factor in the rise of the atmospheric carbon dioxide levels in the industrial age. The carbon dioxide released from burning fossil fuels is produced faster than photosynthetic organisms can use it. This process is intensified by the reduction of photosynthetic trees because of worldwide deforestation. Most scientists agree that high atmospheric carbon dioxide is a major cause of global climate change.Conceptual models are also used to show the flow of energy through particular ecosystems.
Analytical and Simulation Models
The major limitation of conceptual models is their inability to predict the consequences of changes in ecosystem species and/or environment. Ecosystems are dynamic entities and subject to a variety of abiotic and biotic disturbances caused by natural forces and/or human activity. Ecosystems altered from their initial equilibrium state can often recover from such disturbances and return to a state of equilibrium. As most ecosystems are subject to periodic disturbances and are often in a state of change, they are usually either moving toward or away from their equilibrium state. There are many of these equilibrium states among the various components of an ecosystem, which affects the ecosystem overall. Furthermore, as humans have the ability to greatly and rapidly alter the species content and habitat of an ecosystem, the need for predictive models that enable understanding of how ecosystems respond to these changes becomes more crucial.
Analytical models often use simple, linear components of ecosystems, such as food chains, and are known to be complex mathematically; therefore, they require a significant amount of mathematical knowledge and expertise. Although analytical models have great potential, their simplification of complex ecosystems is thought to limit their accuracy. Simulation models that use computer programs are better able to deal with the complexities of ecosystem structure.A recent development in simulation modeling uses supercomputers to create and run individual-based simulations, which accounts for the behavior of individual organisms and their effects on the ecosystem as a whole. These simulations are considered to be the most accurate and predictive of the complex responses of ecosystems to disturbances.
Visit The Darwin Project (http://openstaxcollege.org/l/Darwin_project) to view a variety of ecosystem models.
11.2 | Energy Flow through Ecosystems
All living things require energy in one form or another. Energy is required by most complex metabolic pathways (often in the form of adenosine triphosphate, ATP), especially those responsible for building large molecules from smaller compounds, and life itself is an energy-driven process. Living organisms would not be able to assemble macromolecules(proteins, lipids, nucleic acids, and complex carbohydrates) from their monomeric subunits without a constant energy input.It is important to understand how organisms acquire energy and how that energy is passed from one organism to another through food webs and their constituent food chains. Food webs illustrate how energy flows directionally through ecosystems, including how efficiently organisms acquire it, use it, and how much remains for use by other organisms of the food web.How Organisms Acquire Energy in a Food WebEnergy is acquired by living things in three ways: photosynthesis, chemosynthesis, and the consumption and digestion of other living or previously living organisms by heterotrophs.Photosynthetic and chemosynthetic organisms are both grouped into a category known as autotrophs: organisms capable of synthesizing their own food (more specifically, capable of using inorganic carbon as a carbon source). Photosynthetic autotrophs (photoautotrophs) use sunlight as an energy source, whereas chemosynthetic autotrophs (chemoautotrophs) use inorganic molecules as an energy source. Autotrophs are critical for all ecosystems. Without these organisms, energy would not be available to other living organisms and life itself would not be possible.
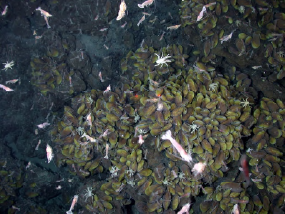
Photoautotrophs, such as plants, algae, and photosynthetic bacteria, serve as the energy source for a majority of the world’s ecosystems. These ecosystems are often described by grazing food webs. Photoautotrophs harness the solar energy of the sun by converting it to chemical energy in the form of ATP (and NADP). The energy stored in ATP is used to synthesize complex organic molecules, such as glucose.Chemoautotrophs are primarily bacteria that are found in rare ecosystems where sunlight is not available, such as in those associated with dark caves or hydrothermal vents at the bottom of the ocean (Figure 11.9). Many chemoautotrophs in hydrothermal vents use hydrogen sulfide (H2S), which is released from the vents as a source of chemical energy. This allows chemoautotrophs to synthesize complex organic molecules, such as glucose, for their own energy and in turn supplies Eifuku volcano off the coast of Japan by the National Oceanic and Atmospheric Administration (NOAA). The summit of this highly active volcano lies 1535 m below the surface.
Productivity within Trophic Levels
Productivity within an ecosystem can be defined as the percentage of energy entering the ecosystem incorporated into biomass in a particular trophic level. Biomass is the total mass, in a unit area at the time of measurement, of living or previously living organisms within a trophic level. Ecosystems have characteristic amounts of biomass at each trophic level.For example, in the English Channel ecosystem the primary producers account for a biomass of 4 g/m2 (grams per meter squared), while the primary consumers exhibit a biomass of 21 g/m2.The productivity of the primary producers is especially important in any ecosystem because these organisms bring energy to other living organisms by photoautotrophy or chemoautotrophy. T
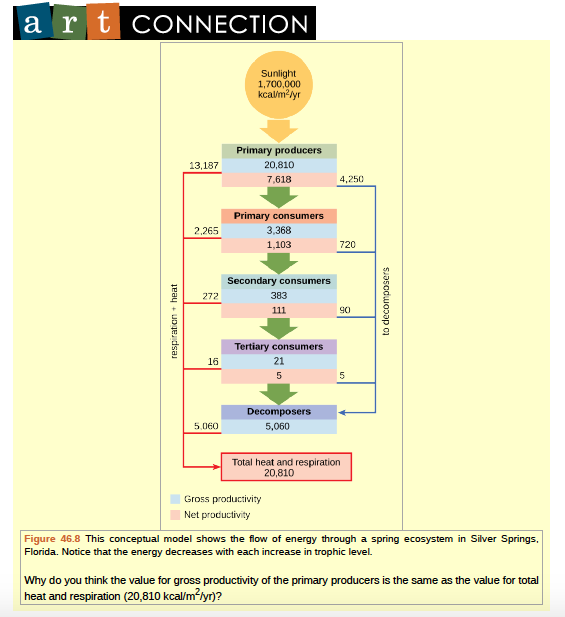
he rate at which photosynthetic primary producers incorporate energy from the sun is called gross primary productivity. An example of gross primary productivity is shownin the compartment diagram of energy flow within the Silver Springs aquatic ecosystem as shown (Figure 11.8). In this ecosystem, the total energy accumulated by the primary producers (gross primary productivity) was shown to be 20,810kcal/m2/yr.Because all organisms need to use some of this energy for their own functions (like respiration and resulting metabolic heat loss) scientists often refer to the net primary productivity of an ecosystem. Net primary productivity is the energy that remains in the primary producers after accounting for the organisms’ respiration and heat loss. The net productivity is then available to the primary consumers at the next trophic level. In our Silver Spring example, 13,187 of the 20,810 kcal/m2/yr were used for respiration or were lost as heat, leaving 7,632 kcal/m2/yr of energy for use by the primary consumers.
Ecological Efficiency: The Transfer of Energy between Trophic Levels
As illustrated in Figure 11.8, large amounts of energy are lost from the ecosystem from one trophic level to the next level as energy flows from the primary producers through the various trophic levels of consumers and decomposers. The main reason for this loss is the second law of thermodynamics, which states that whenever energy is converted from one form to another, there is a tendency toward disorder (entropy) in the system. In biologic systems, this means a great deal of energy is lost as metabolic heat when the organisms from one trophic level consume the next level. In the Silver Springs ecosystem example (Figure 11.8), we see that the primary consumers produced 1103 kcal/m2/yr from the 7618 kcal/m2/yr of energy available to them from the primary producers. The measurement of energy transfer efficiency between two successive trophic levels is termed the trophic level transfer efficiency (TLTE) and is defined by the formula:TLTE = production at present trophic level production at previous trophic level
In Silver Springs, the TLTE between the first two trophic levels was approximately 14.8 percent. The low efficiency of energy transfer between trophic levels is usually the major factor that limits the length of food chains observed in a food web. The fact is, after four to six energy transfers, there is not enough energy left to support another trophic level. In theLake Ontario example shown in Figure 11.6, only three energy transfers occurred between the primary producer, (green algae), and the apex consumer (Chinook salmon).Ecologists have many different methods of measuring energy transfers within ecosystems. Some transfers are easier or more difficult to measure depending on the complexity of the ecosystem and how much access scientists have to observe the ecosystem. In other words, some ecosystems are more difficult to study than others, and sometimes the quantification of energy transfers has to be estimated.Another main parameter that is important in characterizing energy flow within an ecosystem is the net production efficiency.
Net production efficiency (NPE) allows ecologists to quantify how efficiently organisms of a particular trophic level incorporate the energy they receive into biomass; it is calculated using the following formula: NPE = net consumer productivity assimilation Net consumer productivity is the energy content available to the organisms of the next trophic level. Assimilation is the biomass (energy content generated per unit area) of the present trophic level after accounting for the energy lost due to incomplete ingestion of food, energy used for respiration, and energy lost as waste. Incomplete ingestion refers to the fact that some consumers eat only a part of their food. For example, when a lion kills an antelope, it will eat everything except the hide and bones. The lion is missing the energy-rich bone marrow inside the bone, so the lion does not make use of all the calories its prey could provide.
Thus, NPE measures how efficiently each trophic level uses and incorporates the energy from its food into biomass to fuel the next trophic level. In general, cold-blooded animals (ectotherms), such as invertebrates, fish, amphibians, and reptiles, use less of the energy they obtain for respiration and heat than warm-blooded animals (endotherms), such as birds and mammals. The extra heat generated in endotherms, although an advantage in terms of the activity of these organisms in colder environments, is a major disadvantage in terms of NPE. Therefore, many endotherms have to eat more often than ectotherms to get the energy they need for survival. In general, NPE for ectotherms is an order of magnitude (10x) higher than for endotherms. For example, the NPE for a caterpillar eating leaves has been measured at 18 percent, whereas theNPE for a squirrel eating acorns may be as low as 1.6 percent.The inefficiency of energy use by warm-blooded animals has broad implications for the world’s food supply. It is widely accepted that the meat industry uses large amounts of crops to feed livestock, and because the NPE is low, much of the energy from animal feed is lost. For example, it costs about 1Åë to produce 1000 dietary calories (kcal) of corn or soybeans, but approximately $0.19 to produce a similar number of calories growing cattle for beef consumption. The same energy content of milk from cattle is also costly, at approximately $0.16 per 1000 kcal. Much of this difference is due to the lowNPE of cattle. Thus, there has been a growing movement worldwide to promote the consumption of non-meat and non-dairy foods so that less energy is wasted feeding animals for the meat industry.
Modeling Ecosystems Energy Flow: Ecological Pyramids
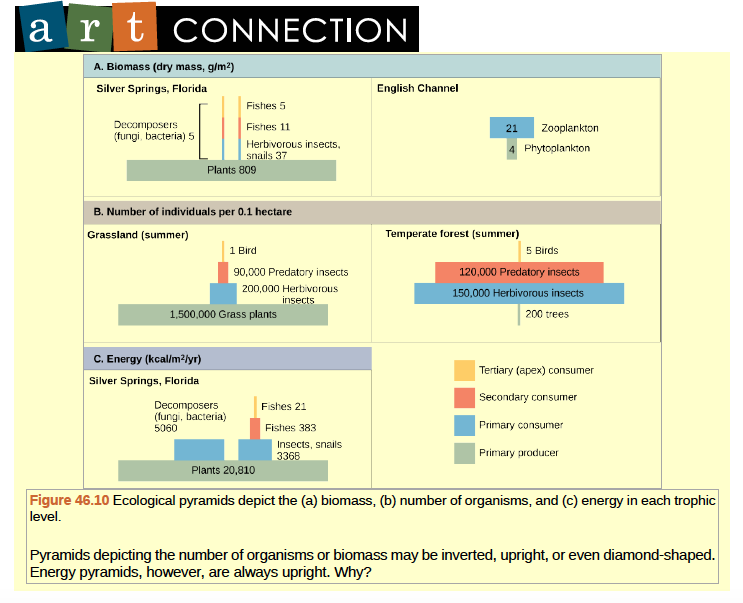
The structure of ecosystems can be visualized with ecological pyramids, which were first described by the pioneering studies of Charles Elton in the 1920s. Ecological pyramids show the relative amounts of various parameters (such as number of organisms, energy, and biomass) across trophic levels.Pyramids of numbers can be either upright or inverted, depending on the ecosystem. As shown in Figure 11.10, typical grassland during the summer has a base of many plants and the numbers of organisms decrease at each trophic level.However, during the summer in a temperate forest, the base of the pyramid consists of few trees compared with the number of primary consumers, mostly insects. Because trees are large, they have great photosynthetic capability, and dominate other plants in this ecosystem to obtain sunlight. Even in smaller numbers, primary producers in forests are still capable of supporting other trophic levels.Another way to visualize ecosystem structure is with pyramids of biomass. This pyramid measures the amount of energy converted into living tissue at the different trophic levels.
Using the Silver Springs ecosystem example, this data exhibits an upright biomass pyramid (Figure 11.10), whereas the pyramid from the English Channel example is inverted. The plants(primary producers) of the Silver Springs ecosystem make up a large percentage of the biomass found there. However, the phytoplankton in the English Channel example make up less biomass than the primary consumers, the zooplankton. As with inverted pyramids of numbers, this inverted pyramid is not due to a lack of productivity from the primary producers, but results from the high turnover rate of the phytoplankton. The phytoplankton are consumed rapidly by the primary consumers, thus, minimizing their biomass at any particular point in time. However, phytoplankton reproduce quickly, thus they are able to support the rest of the ecosystem.
Pyramid ecosystem modeling can also be used to show energy flow through the trophic levels. Notice that these numbers are the same as those used in the energy flow compartment diagram in Figure 11.8. Pyramids of energy are always upright, and an ecosystem without sufficient primary productivity cannot be supported. All types of ecological pyramids are useful for characterizing ecosystem structure. However, in the study of energy flow through the ecosystem, pyramids of energy are the most consistent and representative models of ecosystem structure (Figure 11.10).
Consequences of Food Webs: Biological Magnification
One of the most important environmental consequences of ecosystem dynamics is biomagnification. Biomagnification is the increasing concentration of persistent, toxic substances in organisms at each trophic level, from the primary producersto the apex consumers. Many substances have been shown to bioaccumulate, including classical studies with the pesticidedichlorodiphenyltrichloroethane (DDT), which was published in the 1960s bestseller, Silent Spring, by Rachel Carson.DDT was a commonly used pesticide before its dangers became known. In some aquatic ecosystems, organisms from each trophic level consumed many organisms of the lower level, which caused DDT to increase in birds (apex consumers) that ate fish. Thus, the birds accumulated sufficient amounts of DDT to cause fragility in their eggshells. This effect increased egg breakage during nesting and was shown to have adverse effects on these bird populations. The use of DDT was banned in the United States in the 1970s.
Other substances that biomagnify are polychlorinated biphenyls (PCBs), which were used in coolant liquids in the UnitedStates until their use was banned in 1979, and heavy metals, such as mercury, lead, and cadmium. These substances were best studied in aquatic ecosystems, where fish species at different trophic levels accumulate toxic substances brought through the ecosystem by the primary producers. As illustrated in a study performed by the National Oceanic andAtmospheric Administration (NOAA) in the Saginaw Bay of Lake Huron (Figure 11.11), PCB concentrations increased from the ecosystem’s primary producers (phytoplankton) through the different trophic levels of fish species. The apex consumer (walleye) has more than four times the amount of PCBs compared to phytoplankton. Also, based on results fromChapter 46 | Ecosystems 1379other studies, birds that eat these fish may have PCB levels at least one order of magnitude higher than those found in the lake fish.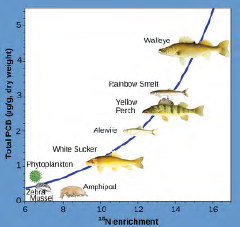
Figure 11.11 This chart shows the PCB concentrations found at the various trophic levels in the Saginaw Bay ecosystem of Lake Huron. Numbers on the x-axis reflect enrichment with heavy isotopes of nitrogen (15N), which is a marker for increasing trophic level. Notice that the fish in the higher trophic levels accumulate more PCBs than those in lower trophic levels. (credit: Patricia Van Hoof, NOAA, GLERL)
Other concerns have been raised by the accumulation of heavy metals, such as mercury and cadmium, in certain types of seafood. The United States Environmental Protection Agency (EPA) recommends that pregnant women and young children should not consume any swordfish, shark, king mackerel, or tilefish because of their high mercury content. These individuals are advised to eat fish low in mercury: salmon, tilapia, shrimp, pollock, and catfish. Biomagnification is a good example of how ecosystem dynamics can affect our everyday lives, even influencing the food we eat.
11.3 | Biogeochemical Cycles
Energy flows directionally through ecosystems, entering as sunlight (or inorganic molecules for chemoautotrophs) and leaving as heat during the many transfers between trophic levels. However, the matter that makes up living organisms is conserved and recycled. The six most common elements associated with organic molecules—carbon, nitrogen, hydrogen, oxygen, phosphorus, and sulfur—take a variety of chemical forms and may exist for long periods in the atmosphere, on land, in water, or beneath the Earth’s surface. Geologic processes, such as weathering, erosion, water drainage, and the subduction of the continental plates, all play a role in this recycling of materials. Because geology and chemistry have major roles in the study of this process, the recycling of inorganic matter between living organisms and their environment is called a biogeochemical cycle.
Water contains hydrogen and oxygen, which is essential to all living processes. The hydrosphere is the area of the Earth where water movement and storage occurs: as liquid water on the surface and beneath the surface or frozen (rivers, lakes, oceans, groundwater, polar ice caps, and glaciers), and as water vapor in the atmosphere. Carbon is found in all organic macromolecules and is an important constituent of fossil fuels. Nitrogen is a major component of our nucleic acids and proteins and is critical to human agriculture. Phosphorus, a major component of nucleic acid (along with nitrogen), is one of the main ingredients in artificial fertilizers used in agriculture and their associated environmental impacts on our surface water. Sulfur, critical to the 3–D folding of proteins (as in disulfide binding), is released into the atmosphere by the burning of fossil fuels, such as coal.The cycling of these elements is interconnected. For example, the movement of water is critical for the leaching of nitrogen and phosphate into rivers, lakes, and oceans. Furthermore, the ocean itself is a major reservoir for carbon. Thus, mineral nutrients are cycled, either rapidly or slowly, through the entire biosphere, from one living organism to another, and between the biotic and abiotic world.Head to this website (http://openstaxcollege.org/l/biogeochemical) to learn more about biogeochemical cycles.The Water (Hydrologic) CycleWater is the basis of all living processes. The human body is more than 1/2 water and human cells are more than 70 percentwater. Thus, most land animals need a supply of fresh water to survive. However, when examining the stores of water onEarth, 97.5 percent of it is non-potable salt water (Figure 11.12). Of the remaining water, 99 percent is locked undergroundas water or as ice. Thus, less than 1 percent of fresh water is easily accessible from lakes and rivers. Many living things, suchas plants, animals, and fungi, are dependent on the small amount of fresh surface water supply, a lack of which can havemassive effects on ecosystem dynamics. Humans, of course, have developed technologies to increase water availability,such as digging wells to harvest groundwater, storing rainwater, and using desalination to obtain drinkable water from theocean. Although this pursuit of drinkable water has been ongoing throughout human history, the
supply of fresh water is still a major issue in modern times.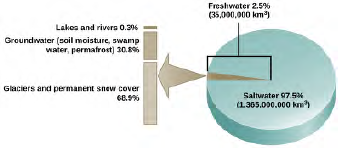 Figure 11.12 Only 2.5 percent of water on Earth is fresh water, and less than 1 percent of fresh water is easilyaccessible to living things.Water cycling is extremely important to ecosystem dynamics. Water has a major influence on climate and, thus, on the environments of ecosystems, some located on distant parts of the Earth. Most of the water on Earth is stored for long periods in the oceans, underground, and as ice. Figure 11.13 illustrates the average time that an individual water molecule may spend in the Earth’s major water reservoirs. Residence time is a measure of the average time an individual water molecule stays in a particular reservoir. A large amount of the Earth’s water is locked in place in these reservoirs as ice, beneath the
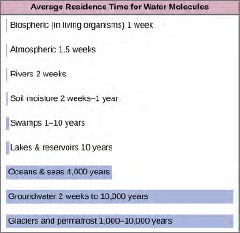 Figure 11.13 This graph shows the average residence time for water molecules in the Earth’s water reservoirs.There are various processes that occur during the cycling of water, shown in Figure 11.14. These processes include thefollowing:• evaporation/sublimation• condensation/precipitation• subsurface water flow• surface runoff/snowmelt• streamflowThe water cycle is driven by the sun’s energy as it warms the oceans and other surface waters. This leads to the evaporation(water to water vapor) of liquid surface water and the sublimation (ice to water vapor) of frozen water, which deposits largeamounts of water vapor into the atmosphere. Over time, this water vapor condenses into clouds as liquid or frozen dropletsand is eventually followed by precipitation (rain or snow), which returns water to the Earth’s surface. Rain eventuallypermeates into the ground, where it may evaporate again if it is near the surface, flow beneath the surface, or be stored forlong periods. More easily observed is surface runoff: the flow of fresh water either from rain or melting ice. Runoff can thenmake its way through streams and lakes to the oceans or flow directly to the oceans themselves.Head to this website (http://openstaxcollege.org/l/freshwater) to learn more about the world’s fresh water supply.Rain and surface runoff are major ways in which minerals, including carbon, nitrogen, phosphorus, and sulfur, are cycled from land to water. The environmental effects of runoff will be discussed later as these cycles are described.
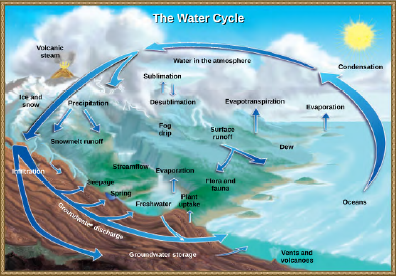 Figure 11.14 Water from the land and oceans enters the atmosphere by evaporation or sublimation, where itcondenses into clouds and falls as rain or snow. Precipitated water may enter freshwater bodies or infiltrate the soil.The cycle is complete when surface or groundwater reenters the ocean. (credit: modification of work by John M. Evansand Howard Perlman, USGS).
The Carbon Cycle
Carbon is the second most abundant element in living organisms. Carbon is present in all organic molecules, and its rolein the structure of macromolecules is of primary importance to living organisms. Carbon compounds contain especiallyhigh energy, particularly those derived from fossilized organisms, mainly plants, which humans use as fuel. Since the1800s, the number of countries using massive amounts of fossil fuels has increased. Since the beginning of the IndustrialRevolution, global demand for the Earth’s limited fossil fuel supplies has risen; therefore, the amount of carbon dioxidein our atmosphere has increased. This increase in carbon dioxide has been associated with climate change and otherdisturbances of the Earth’s ecosystems and is a major environmental concern worldwide. Thus, the “carbon footprint” isbased on how much carbon dioxide is produced and how much fossil fuel countries consume.The carbon cycle is most easily studied as two interconnected sub-cycles: one dealing with rapid carbon exchange amongliving organisms and the other dealing with the long-term cycling of carbon through geologic processes. The entire carboncycle is shown in Figure 11.15.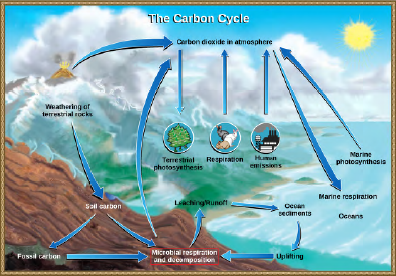
Figure 11.15 Carbon dioxide gas exists in the atmosphere and is dissolved in water. Photosynthesis converts carbondioxide gas to organic carbon, and respiration cycles the organic carbon back into carbon dioxide gas. Long-termstorage of organic carbon occurs when matter from living organisms is buried deep underground and becomesfossilized. Volcanic activity and, more recently, human emissions, bring this stored carbon back into the carbon cycle.(credit: modification of work by John M. Evans and Howard Perlman, USGS)Click this link (http://openstaxcollege.org/l/carbon_cycle) to read information about the United States Carbon CycleScience Program.The Biological Carbon CycleLiving organisms are connected in many ways, even between ecosystems. A good example of this connection is theexchange of carbon between autotrophs and heterotrophs within and between ecosystems by way of atmospheric carbondioxide. Carbon dioxide is the basic building block that most autotrophs use to build multi-carbon, high energy compounds,such as glucose. The energy harnessed from the sun is used by these organisms to form the covalent bonds that linkcarbon atoms together. These chemical bonds thereby store this energy for later use in the process of respiration. Mostterrestrial autotrophs obtain their carbon dioxide directly from the atmosphere, while marine autotrophs acquire it in thedissolved form (carbonic acid, H2CO3−). However carbon dioxide is acquired, a by-product of the process is oxygen. Thephotosynthetic organisms are responsible for depositing approximately 21 percent oxygen content of the atmosphere thatwe observe today.Heterotrophs and autotrophs are partners in biological carbon exchange (especially the primary consumers, largelyherbivores). Heterotrophs acquire the high-energy carbon compounds from the autotrophs by consuming them, and breakingthem down by respiration to obtain cellular energy, such as ATP. The most efficient type of respiration, aerobic respiration,requires oxygen obtained from the atmosphere or dissolved in water. Thus, there is a constant exchange of oxygen and1384 Chapter 46 | EcosystemsThis OpenStax book is available for free at http://cnx.org/content/col11448/1.10carbon dioxide between the autotrophs (which need the carbon) and the heterotrophs (which need the oxygen). Gasexchange through the atmosphere and water is one way that the carbon cycle connects all living organisms on Earth.The Biogeochemical Carbon CycleThe movement of carbon through the land, water, and air is complex, and in many cases, it occurs much more slowlygeologically than as seen between living organisms. Carbon is stored for long periods in what are known as carbonreservoirs, which include the atmosphere, bodies of liquid water (mostly oceans), ocean sediment, soil, land sediments(including fossil fuels), and the Earth’s interior.As stated, the atmosphere is a major reservoir of carbon in the form of carbon dioxide and is essential to the process of photosynthesis. The level of carbon dioxide in the atmosphere is greatly influenced by the reservoir of carbon in the oceans.The exchange of carbon between the atmosphere and water reservoirs influences how much carbon is found in each location,and each one affects the other reciprocally. Carbon dioxide (CO2) from the atmosphere dissolves in water and combineswith water molecules to form carbonic acid, and then it ionizes to carbonate and bicarbonate ions (Figure 11.16)
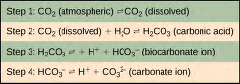
Figure 11.16 Carbon dioxide reacts with water to form bicarbonate and carbonate ions.The equilibrium coefficients are such that more than 90 percent of the carbon in the ocean is found as bicarbonate ions.Some of these ions combine with seawater calcium to form calcium carbonate (CaCO3), a major component of marineorganism shells. These organisms eventually form sediments on the ocean floor. Over geologic time, the calcium carbonateforms limestone, which comprises the largest carbon reservoir on Earth.On land, carbon is stored in soil as a result of the decomposition of living organisms (by decomposers) or from weatheringof terrestrial rock and minerals. This carbon can be leached into the water reservoirs by surface runoff. Deeper underground,on land and at sea, are fossil fuels: the anaerobically decomposed remains of plants that take millions of years to form.Fossil fuels are considered a non-renewable resource because their use far exceeds their rate of formation. A non-renewableresource, such as fossil fuel, is either regenerated very slowly or not at all. Another way for carbon to enter the atmosphereis from land (including land beneath the surface of the ocean) by the eruption of volcanoes and other geothermal systems.Carbon sediments from the ocean floor are taken deep within the Earth by the process of subduction: the movement of onetectonic plate beneath another. Carbon is released as carbon dioxide when a volcano erupts or from volcanic hydrothermalvents.Carbon dioxide is also added to the atmosphere by the animal husbandry practices of humans. The large numbers of landanimals raised to feed the Earth’s growing population results in increased carbon dioxide levels in the atmosphere due tofarming practices and the respiration and methane production. This is another example of how human activity indirectlyaffects biogeochemical cycles in a significant way. Although much of the debate about the future effects of increasingatmospheric carbon on climate change focuses on fossils fuels, scientists take natural processes, such as volcanoes andrespiration, into account as they model and predict the future impact of this increase.The Nitrogen CycleGetting nitrogen into the living world is difficult. Plants and phytoplankton are not equipped to incorporate nitrogen fromthe atmosphere (which exists as tightly bonded, triple covalent N2) even though this molecule comprises approximately78 percent of the atmosphere. Nitrogen enters the living world via free-living and symbiotic bacteria, which incorporatenitrogen into their macromolecules through nitrogen fixation (conversion of N2). Cyanobacteria live in most aquaticecosystems where sunlight is present; they play a key role in nitrogen fixation. Cyanobacteria are able to use inorganicsources of nitrogen to “fix” nitrogen. Rhizobium bacteria live symbiotically in the root nodules of legumes (such as peas,beans, and peanuts) and provide them with the organic nitrogen they need. Free-living bacteria, such as Azotobacter, arealso important nitrogen fixers.Organic nitrogen is especially important to the study of ecosystem dynamics since many ecosystem processes, such asprimary production and decomposition, are limited by the available supply of nitrogen. As shown in Figure 46.17, thenitrogen that enters living systems by nitrogen fixation is successively converted from organic nitrogen back into nitrogengas by bacteria. This process occurs in three steps in terrestrial systems: ammonification, nitrification, and denitrification.First, the ammonification process converts nitrogenous waste from living animals or from the remains of dead animalsChapter 46 | Ecosystems 1385into ammonium (NH4+) by certain bacteria and fungi. Second, the ammonium is converted to nitrites (NO2−) by nitrifyingbacteria, such as Nitrosomonas, through nitrification. Subsequently, nitrites are converted to nitrates (NO3−) by similarorganisms. Third, the process of denitrification occurs, whereby bacteria, such as Pseudomonas and Clostridium, convertthe nitrates into nitrogen gas, allowing it to re-enter the atmosphere.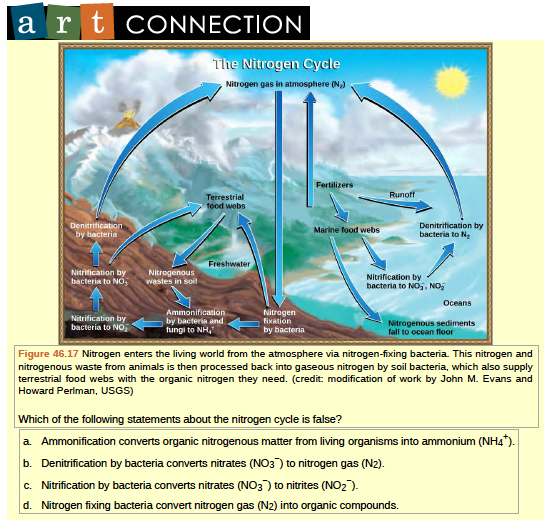 Figure 11.17
Nitrogen enters the living world from the atmosphere via nitrogen-fixing bacteria. This nitrogen andnitrogenous waste from animals is then processed back into gaseous nitrogen by soil bacteria, which also supplyterrestrial food webs with the organic nitrogen they need. (credit: modification of work by John M. Evans andHoward Perlman, USGS)Which of the following statements about the nitrogen cycle is false?a. Ammonification converts organic nitrogenous matter from living organisms into ammonium (NH4+).b. Denitrification by bacteria converts nitrates (NO3−) to nitrogen gas (N2).c. Nitrification by bacteria converts nitrates (NO3−) to nitrites (NO2−).d. Nitrogen fixing bacteria convert nitrogen gas (N2) into organic compounds.Human activity can release nitrogen into the environment by two primary means: the combustion of fossil fuels, whichreleases different nitrogen oxides, and by the use of artificial fertilizers in agriculture, which are then washed into lakes,streams, and rivers by surface runoff. Atmospheric nitrogen is associated with several effects on Earth’s ecosystemsincluding the production of acid rain (as nitric acid, HNO3) and greenhouse gas (as nitrous oxide, N2O) potentially causingclimate change. A major effect from fertilizer runoff is saltwater and freshwater eutrophication, a process whereby nutrientrunoff causes the excess growth of microorganisms, depleting dissolved oxygen levels and killing ecosystem fauna.A similar process occurs in the marine nitrogen cycle, where the ammonification, nitrification, and denitrification processesare performed by marine bacteria. Some of this nitrogen falls to the ocean floor as sediment, which can then be moved toland in geologic time by uplift of the Earth’s surface and thereby incorporated into terrestrial rock. Although the movement of nitrogen from rock directly into living systems has been traditionally seen as insignificant compared with nitrogen fixedfrom the atmosphere, a recent studyPhosphorus is an essential nutrient for living processes; it is a major component of nucleic acid and phospholipids, and, ascalcium phosphate, makes up the supportive components of our bones. Phosphorus is often the limiting nutrient (necessaryfor growth) in aquatic ecosystems (Figure 11.18).Phosphorus occurs in nature as the phosphate ion (PO43−). In addition to phosphate runoff as a result of human activity,natural surface runoff occurs when it is leached from phosphate-containing rock by weathering, thus sending phosphatesinto rivers, lakes, and the ocean. This rock has its origins in the ocean. Phosphate-containing ocean sediments form primarilyfrom the bodies of ocean organisms and from their excretions. However, in remote regions, volcanic ash, aerosols, andmineral dust may also be significant phosphate sources. This sediment then is moved to land over geologic time by theuplifting of areas of the Earth’s surface.Phosphorus is also reciprocally exchanged between phosphate dissolved in the ocean and marine ecosystems. The movement of phosphate from the ocean to the land and through the soil is extremely slow, with the average phosphate ion having an oceanic residence time between 20,000 and 100,000 years.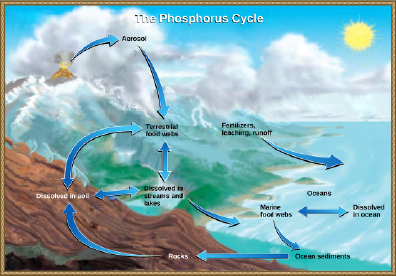
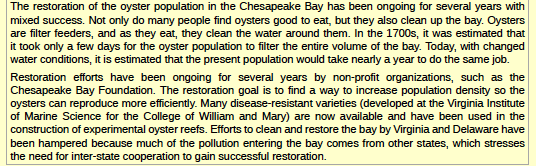
Figure 11.18 In nature, phosphorus exists as the phosphate ion (PO43−). Weathering of rocks and volcanic activityreleases phosphate into the soil, water, and air, where it becomes available to terrestrial food webs. Phosphate entersthe oceans via surface runoff, groundwater flow, and river flow. Phosphate dissolved in ocean water cycles into marinefood webs. Some phosphate from the marine food webs falls to the ocean floor, where it forms sediment. (credit:modification of work by John M. Evans and Howard Perlman, USGS)Excess phosphorus and nitrogen that enters these ecosystems from fertilizer runoff and from sewage causes excessivegrowth of microorganisms and depletes the dissolved oxygen, which leads to the death of many ecosystem fauna, such asshellfish and finfish. This process is responsible for dead zones in lakes and at the mouths of many major rivers (Figure46.18).3. Scott L. Morford, Benjamin Z. Houlton, and Randy A. Dahlgren, “Increased Forest Ecosystem Carbon and Nitrogen Storage from Nitrogen RichBedrock,” Nature 477, no. 7362 (2011): 78–81.Chapter 46 | Ecosystems 1387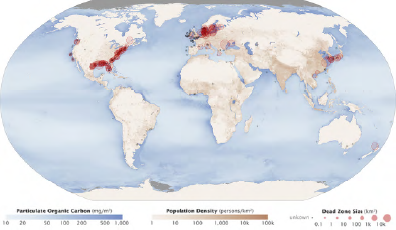 Figure 46.19 Dead zones occur when phosphorus and nitrogen from fertilizers cause excessive growth ofmicroorganisms, which depletes oxygen and kills fauna. Worldwide, large dead zones are found in coastal areas ofhigh population density. (credit: NASA Earth Observatory)A dead zone is an area within a freshwater or marine ecosystem where large areas are depleted of their normal flora andfauna; these zones can be caused by eutrophication, oil spills, dumping of toxic chemicals, and other human activities. Thenumber of dead zones has been increasing for several years, and more than 400 of these zones were present as of 2008.One of the worst dead zones is off the coast of the United States in the Gulf of Mexico, where fertilizer runoff from theMississippi River basin has created a dead zone of over 8463 square miles. Phosphate and nitrate runoff from fertilizers alsonegatively affect several lake and bay ecosystems including the Chesapeake Bay in the eastern United States.1388 Chapter 46 | EcosystemsThis OpenStax book is available for free at http://cnx.org/content/col11448/1.10Chesapeake BayFigure 46.20 This (a) satellite image shows the Chesapeake Bay, an ecosystem affected by phosphate and nitraterunoff. A (b) member of the Army Corps of Engineers holds a clump of oysters being used as a part of the oysterrestoration effort in the bay. (credit a: modification of work by NASA/MODIS; credit b: modification of work by U.S.Army)The Chesapeake Bay has long been valued as one of the most scenic areas on Earth; it is now in distressand is recognized as a declining ecosystem. In the 1970s, the Chesapeake Bay was one of the firstecosystems to have identified dead zones, which continue to kill many fish and bottom-dwelling species,such as clams, oysters, and worms. Several species have declined in the Chesapeake Bay due to surfacewater runoff containing excess nutrients from artificial fertilizer used on land. The source of the fertilizers(with high nitrogen and phosphate content) is not limited to agricultural practices. There are many nearbyurban areas and more than 150 rivers and streams empty into the bay that are carrying fertilizer runofffrom lawns and gardens. Thus, the decline of the Chesapeake Bay is a complex issue and requires thecooperation of industry, agriculture, and everyday homeowners.Of particular interest to conservationists is the oyster population; it is estimated that more than 200,000acres of oyster reefs existed in the bay in the 1700s, but that number has now declined to only 36,000acres. Oyster harvesting was once a major industry for Chesapeake Bay, but it declined 88 percent between1982 and 2007. This decline was due not only to fertilizer runoff and dead zones but also to overharvesting.Oysters require a certain minimum population density because they must be in close proximity to reproduce.Human activity has altered the oyster population and locations, greatly disrupting the ecosystem.The restoration of the oyster population in the Chesapeake Bay has been ongoing for several years withmixed success. Not only do many people find oysters good to eat, but they also clean up the bay. Oystersare filter feeders, and as they eat, they clean the water around them. In the 1700s, it was estimated thatit took only a few days for the oyster population to filter the entire volume of the bay. Today, with changedwater conditions, it is estimated that the present population would take nearly a year to do the same job.Restoration efforts have been ongoing for several years by non-profit organizations, such as theChesapeake Bay Foundation. The restoration goal is to find a way to increase population density so theoysters can reproduce more efficiently. Many disease-resistant varieties (developed at the Virginia Instituteof Marine Science for the College of William and Mary) are now available and have been used in theconstruction of experimental oyster reefs. Efforts to clean and restore the bay by Virginia and Delaware havebeen hampered because much of the pollution entering the bay comes from other states, which stressesthe need for inter-state cooperation to gain successful restoration.Chapter 46 | Ecosystems 1389The new, hearty oyster strains have also spawned a new and economically viable industry—oysteraquaculture—which not only supplies oysters for food and profit, but also has the added benefit of cleaningthe bay.
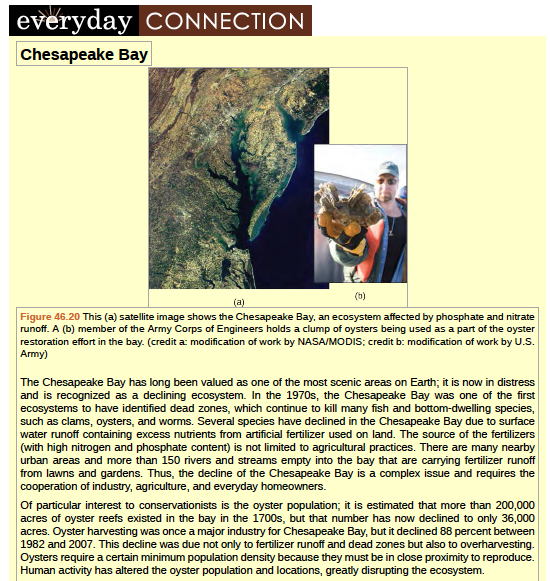

The Sulfur Cycle
Sulfur is an essential element for the macromolecules of living things. As a part of the amino acid cysteine, it is involvedin the formation of disulfide bonds within proteins, which help to determine their 3-D folding patterns, and hence theirfunctions. As shown in Figure 11.20, sulfur cycles between the oceans, land, and atmosphere. Atmospheric sulfur is foundin the form of sulfur dioxide (SO2) and enters the atmosphere in three ways: from the decomposition of organic molecules,from volcanic activity and geothermal vents, and from the burning of fossil fuels by humans.
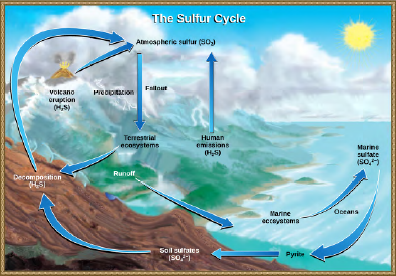
Figure 11.21 Sulfur dioxide from the atmosphere becomes available to terrestrial and marine ecosystems when it isdissolved in precipitation as weak sulfuric acid or when it falls directly to the Earth as fallout. Weathering of rocks alsomakes sulfates available to terrestrial ecosystems. Decomposition of living organisms returns sulfates to the ocean,soil and atmosphere. (credit: modification of work by John M. Evans and Howard Perlman, USGS)On land, sulfur is deposited in four major ways: precipitation, direct fallout from the atmosphere, rock weathering, andgeothermal vents (Figure 11.21). Atmospheric sulfur is found in the form of sulfur dioxide (SO2), and as rain falls throughthe atmosphere, sulfur is dissolved in the form of weak sulfuric acid (H2SO4). Sulfur can also fall directly from theatmosphere in a process called fallout. Also, the weathering of sulfur-containing rocks releases sulfur into the soil. Theserocks originate from ocean sediments that are moved to land by the geologic uplifting of ocean sediments. Terrestrialecosystems can then make use of these soil sulfates ( SO4− ), and upon the death and decomposition of these organisms,release the sulfur back into the atmosphere as hydrogen sulfide (H2S) gas.1390 Chapter 46 | EcosystemsThis OpenStax book is available for free at http://cnx.org/content/col11448/1.10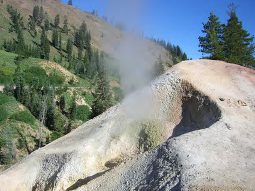
Figure 11.22 At this sulfur vent in Lassen Volcanic National Park in northeastern California, the yellowish sulfurdeposits are visible near the mouth of the vent.Sulfur enters the ocean via runoff from land, from atmospheric fallout, and from underwater geothermal vents. Someecosystems (Figure 46.9) rely on chemoautotrophs using sulfur as a biological energy source. This sulfur then supportsmarine ecosystems in the form of sulfates.Human activities have played a major role in altering the balance of the global sulfur cycle. The burning of large quantitiesof fossil fuels, especially from coal, releases larger amounts of hydrogen sulfide gas into the atmosphere. As rain fallsthrough this gas, it creates the phenomenon known as acid rain. Acid rain is corrosive rain caused by rainwater falling tothe ground through sulfur dioxide gas, turning it into weak sulfuric acid, which causes damage to aquatic ecosystems. Acidrain damages the natural environment by lowering the pH of lakes, which kills many of the resident fauna; it also affectsthe man-made environment through the chemical degradation of buildings. For example, many marble monuments, such asthe Lincoln Memorial in Washington, DC, have suffered significant damage from acid rain over the years. These examplesshow the wide-ranging effects of human activities on our environment and the challenges that remain for our future.Click this link (http://openstaxcollege.org/l/climate_change) to learn more about global climate change.acid rainanalytical modelapex consumerassimilationbiogeochemical cyclebiomagnificationbiomasschemoautotrophconceptual modeldead zonedetrital food webecological pyramidecosystemecosystem dynamicsequilibriumeutrophicationfalloutfood chainfood webgrazing food webgross primary productivityholistic ecosystem model
KEY TERMScorrosive rain caused by rainwater falling to the ground through sulfur dioxide gas, turning it into weak sulfuricacid; can damage structures and ecosystemsecosystem model that is created with mathematical formulas to predict the effects of environmentaldisturbances on ecosystem structure and dynamicsorganism at the top of the food chainbiomass consumed and assimilated from the previous trophic level after accounting for the energy lost due toincomplete ingestion of food, energy used for respiration, and energy lost as wastecycling of mineral nutrients through ecosystems and through the non-living worldincreasing concentrations of persistent, toxic substances in organisms at each trophic level, from theprimary producers to the apex consumerstotal weight, at the time of measurement, of living or previously living organisms in a unit area within a trophiclevelorganism capable of synthesizing its own food using energy from inorganic molecules(also, compartment models) ecosystem model that consists of flow charts that show the interactionsof different compartments of the living and non-living components of the ecosystemarea within an ecosystem in lakes and near the mouths of rivers where large areas of ecosystems are depleted oftheir normal flora and fauna; these zones can be caused by eutrophication, oil spills, dumping of toxic chemicals, andother human activitiestype of food web in which the primary consumers consist of decomposers; these are often associatedwith grazing food webs within the same ecosystem(also, Eltonian pyramid) graphical representation of different trophic levels in an ecosystem basedof organism numbers, biomass, or energy contentcommunity of living organisms and their interactions with their abiotic environmentstudy of the changes in ecosystem structure caused by changes in the environment or internalforcessteady state of an ecosystem where all organisms are in balance with their environment and each otherprocess whereby nutrient runoff causes the excess growth of microorganisms, depleting dissolved oxygenlevels and killing ecosystem faunadirect deposit of solid minerals on land or in the ocean from the atmospherelinear representation of a chain of primary producers, primary consumers, and higher-level consumers used todescribe ecosystem structure and dynamicsgraphic representation of a holistic, non-linear web of primary producers, primary consumers, and higher-levelconsumers used to describe ecosystem structure and dynamicstype of food web in which the primary producers are either plants on land or phytoplankton in thewater; often associated with a detrital food web within the same ecosystemrate at which photosynthetic primary producers incorporate energy from the sunstudy that attempts to quantify the composition, interactions, and dynamics of entireecosystems; often limited by economic and logistical difficulties, depending on the ecosystem1392 Chapter 46 | EcosystemsThis OpenStax book is available for free at http://cnx.org/content/col11448/1.10hydrospheremesocosmmicrocosmnet consumer productivitynet primary productivitynet production efficiency (NPE)non-renewable resourceprimary consumerprimary producerresidence timeresilience (ecological)resistance (ecological)secondary consumersimulation modelsubductiontertiary consumertrophic leveltrophic level transfer efficiency (TLTE)area of the Earth where water movement and storage occursportion of a natural ecosystem to be used for experimentsre-creation of natural ecosystems entirely in a laboratory environment to be used for experimentsenergy content available to the organisms of the next trophic levelenergy that remains in the primary producers after accounting for the organisms’ respirationand heat lossmeasure of the ability of a trophic level to convert the energy it receives from theprevious trophic level into biomassresource, such as fossil fuel, that is either regenerated very slowly or not at alltrophic level that obtains its energy from the primary producers of an ecosystemtrophic level that obtains its energy from sunlight, inorganic chemicals, or dead and/or decayingorganic materialmeasure of the average time an individual water molecule stays in a particular reservoirspeed at which an ecosystem recovers equilibrium after being disturbedability of an ecosystem to remain at equilibrium in spite of disturbancesusually a carnivore that eat primary consumersecosystem model that is created with computer programs to holistically model ecosystems and topredict the effects of environmental disturbances on ecosystem structure and dynamicsmovement of one tectonic plate beneath anothercarnivore that eat other carnivoresposition of a species or group of species in a food chain or a food webenergy transfer efficiency between two successive trophic levelsCHAPTER SUMMARY46.1 Ecology of EcosystemsEcosystems exist on land, at sea, in the air, and underground. Different ways of modeling ecosystems are necessary tounderstand how environmental disturbances will affect ecosystem structure and dynamics. Conceptual models are usefulto show the general relationships between organisms and the flow of materials or energy between them. Analytical modelsare used to describe linear food chains, and simulation models work best with holistic food webs.46.2 Energy Flow through EcosystemsOrganisms in an ecosystem acquire energy in a variety of ways, which is transferred between trophic levels as the energyflows from the bottom to the top of the food web, with energy being lost at each transfer. The efficiency of these transfersis important for understanding the different behaviors and eating habits of warm-blooded versus cold-blooded animals.Modeling of ecosystem energy is best done with ecological pyramids of energy, although other ecological pyramidsprovide other vital information about ecosystem structure.46.3 Biogeochemical CyclesMineral nutrients are cycled through ecosystems and their environment. Of particular importance are water, carbon,nitrogen, phosphorus, and sulfur. All of these cycles have major impacts on ecosystem structure and function. As humanactivities have caused major disturbances to these cycles, their study and modeling is especially important. A variety ofChapter 46 | Ecosystems 1393human activities, such as pollution, oil spills, and events) have damaged ecosystems, potentially causing global climatechange. The health of Earth depends on understanding these cycles and how to protect the environment from irreversibledamage.ART CONNECTION QUESTIONS1. Figure 46.8 Why do you think the value for grossproductivity of the primary producers is the same as thevalue for total heat and respiration (20,810 kcal/m2/yr)?2. Figure 46.10 Pyramids depicting the number oforganisms or biomass may be inverted, upright, or evendiamond-shaped. Energy pyramids, however, are alwaysupright. Why?3. Figure 46.17 Which of the following statements aboutthe nitrogen cycle is false?a. Ammonification converts organic nitrogenousmatter from living organisms into ammonium(NH4+).b. Denitrification by bacteria converts nitrates(NO3−) to nitrogen gas (N2).c. Nitrification by bacteria converts nitrates (NO3−)to nitrites (NO2−).d. Nitrogen fixing bacteria convert nitrogen gas(N2) into organic compounds.REVIEW QUESTIONS4. The ability of an ecosystem to return to its equilibriumstate after an environmental disturbance is called________.a. resistanceb. restorationc. reformationd. resilience5. A re-created ecosystem in a laboratory environment isknown as a ________.a. mesocosmb. simulationc. microcosmd. reproduction6. Decomposers are associated with which class of foodweb?a. grazingb. detritalc. invertedd. aquatic7. The primary producers in an ocean grazing food webare usually ________.a. plantsb. animalsc. fungid. phytoplankton8. What term describes the use of mathematical equationsin the modeling of linear aspects of ecosystems?a. analytical modelingb. simulation modelingc. conceptual modelingd. individual-based modeling9. The position of an organism along a food chain isknown as its ________.a. locusb. locationc. trophic leveld. microcosm10. The weight of living organisms in an ecosystem at aparticular point in time is called:a. energyb. productionc. entropyd. biomass11. Which term describes the process whereby toxicsubstances increase along trophic levels of an ecosystem?a. biomassificationb. biomagnificationc. bioentropyd. heterotrophy12. Organisms that can make their own food usinginorganic molecules are called:a. autotrophsb. heterotrophsc. photoautotrophsd. chemoautotrophs13. In the English Channel ecosystem, the number ofprimary producers is smaller than the number of primaryconsumers because________.a. the apex consumers have a low turnover rateb. the primary producers have a low turnover ratec. the primary producers have a high turnover rated. the primary consumers have a high turnover rate14. What law of chemistry determines how much energycan be transferred when it is converted from one form toanother?a. the first law of thermodynamicsb. the second law of thermodynamicsc. the conservation of matterd. the conservation of energy15. The movement of mineral nutrients through organismsand their environment is called a ________ cycle.a. biological1394 Chapter 46 | EcosystemsThis OpenStax book is available for free at http://cnx.org/content/col11448/1.10b. bioaccumulationc. biogeochemicald. biochemical16. Carbon is present in the atmosphere as ________.a. carbon dioxideb. carbonate ionc. carbon dustd. carbon monoxide17. The majority of water found on Earth is:a. iceb. water vaporc. fresh waterd. salt water18. The average time a molecule spends in its reservoir isknown as ________.a. residence timeb. restriction timec. resilience timed. storage time19. The process whereby oxygen is depleted by thegrowth of microorganisms due to excess nutrients inaquatic systems is called ________.a. dead zoningb. eutrophicationc. retroficationd. depletion20. The process whereby nitrogen is brought into organicmolecules is called ________.a. nitrificationb. denitrificationc. nitrogen fixationd. nitrogen cyclingCRITICAL THINKING QUESTIONS21. Compare and contrast food chains and food webs.What are the strengths of each concept in describingecosystems?22. Describe freshwater, ocean, and terrestrial ecosystems.23. Compare grazing and detrital food webs. Why wouldthey both be present in the same ecosystem?24. Compare the three types of ecological pyramids andhow well they describe ecosystem structure. Identifywhich ones can be inverted and give an example of aninverted pyramid for each.25. How does the amount of food a warm blooded-animal(endotherm) eats relate to its net production efficiency(NPE)?26. Describe nitrogen fixation and why it is important toagriculture.27. What are the factors that cause dead zones? Describeeutrophication, in particular, as a cause.28. Why are drinking water supplies still a
Adapted from:
OpenStax, Biology. OpenStax. May 20, 2013. <http://cnx.org/content/col11448/latest/>
“Download for free at http://cnx.org/content/col11448/latest/.”
