
Atmosphere and Weather
8.3 Wind Power
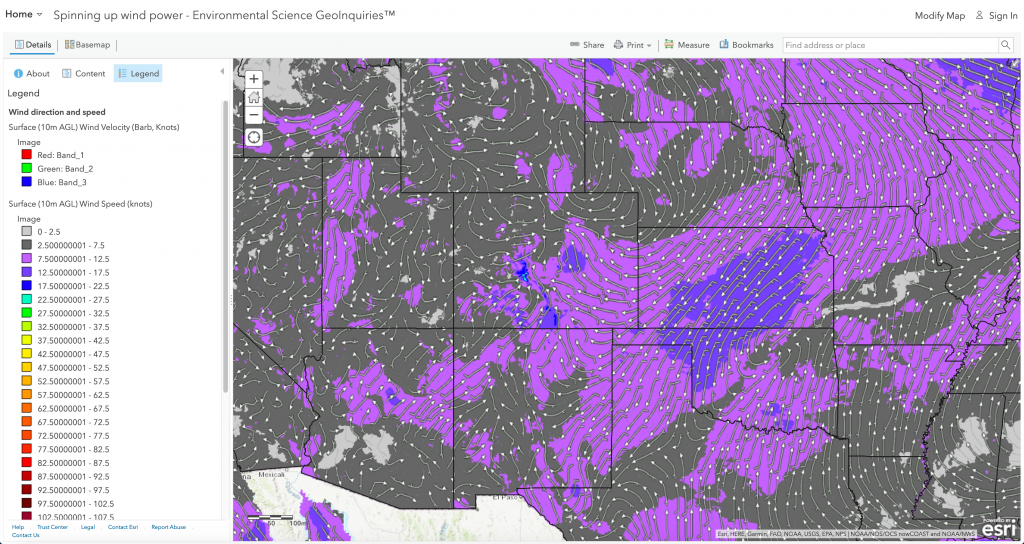
What are the typical wind conditions in the United States?
Step 1: Go to the ArcGIS Online map, Spinning Up Wind Power, and explore the map.
Step 2: In the Details pane, click the button, Show Map Legend. The map shows typical winds across the United States.
- Where is the wind speed the highest? What direction is it blowing?
- What is your local wind speed and wind direction?
Where is the highest potential capacity for wind power?
Step 3: Click the checkbox to the left of the layer, Wind Capacity.
- What states have the highest potential for wind power based on average wind speeds and suitable land available?
Step 4: Click the markers on the map to view the details of various states.
Step 5: Hover the mouse over the layer name, Wind Capacity. Click the button, Show Table.
Step 6: In the table, click the column header for Installed Wind Power in 1999. Sort descending.
Step 7: In the table, click the column header for Installed Wind Power in 2015. Also, sort descending.
- Which state has shown the most significant increase?
Why does Texas have the most significant wind-power capacity?
Wind-power capacity is determined by average wind speed, number of windy days, land use, and topography.
Step 8: Turn on the Texas Wind Farm layer.
- Based on the placement of the wind turbines, where is the average wind speed the highest?
- Wind power measures the energy available in the wind. Cube the wind speed to determine wind power. What is the power from an average wind speed of 8 mph and 10 mph?
How has Texas developed its wind power?
- Where are the highest power demands?
Step 9: Click the button, Measure. Choose the Distance button and set units to miles. Consider how far it is for a wind farm (a group of linked wind turbines) to a large city such as Dallas or Austin.
Step 10: Turn on the CREZ layer.
- What patterns do you notice?
Step 11: Zoom in on wind turbines for site details.
How can renewable power supply a city’s electricity demands?
Step 12: Turn on the layer, Map Notes.
Step 13: Zoom in to Georgetown, TX. Click the pop-up to read about the city’s power plans for 2017.
- How many wind turbines will Georgetown need to supply 50 percent of their power needs? (Zoom in and click individual wind turbines for detailed energy generation information.)
City planners cite cost savings for their decisions to have wind farms. But the city could also benefit from them such as better air quality, less groundwater contamination, and no noise from drilling.
