
Regional and Global Climates and Change
10.2 El Nino and La Nina
Is the weather the same from year to year?
Step 1: Go to the ArcGIS Online map, El Nino, and explore the map.
Step 2: Observe the map with the data layer, Snow Cover: January 2016.
- What parts of the world experienced snow cover? What about your current location?
- Is there always the same amount of snow at your location?
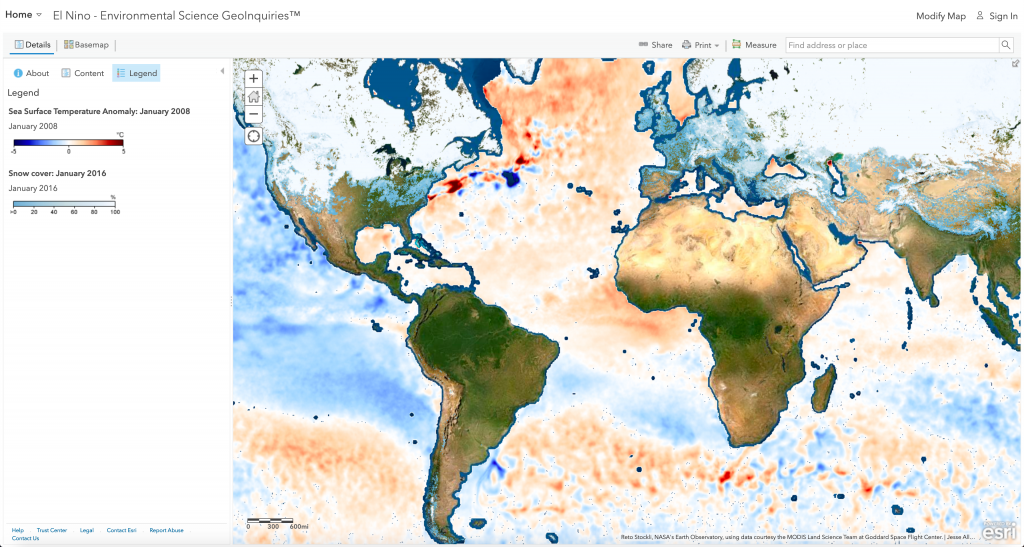
How are sea surface temperatures different around the globe?
Step 3: The year range of 2015-2016 was considered a moderate El Nino event. From the Details pane, click the button, Show Contents of Map.
Step 4: Click the checkbox to the left of the layer name, Sea Surface Temperature Anomaly: January 2016.
- Falling average temperature patterns are a SST anomaly in the Pacific Ocean? (T/F)
- What are some possible factors that may influence ocean temperatures throughout a given year?
What is some possible feedback of warmer sea surface temperatures?
Step 5: Click the checkbox to the left of the layer name, Global Temperature Anomaly: January 2016. January 2016 was considered the peak heating of the Pacific Ocean.
- Some of the global temperature anomalies in the United States include cooler temperatures in the Southwest and warmer temperatures in the East and Northeast.
- Do the sea surface temperature patterns that you previously observed correspond to the observed land surface temperature anomaly layer currently visible? Explain your reasoning.
How would warmer ocean temperatures affect precipitation?
Step 6: Click the checkbox to the left of the layer name, Water Equivalent Anomaly: September 2009.
- El Nino events tend to bring cooler, wetter conditions to California.
Is there an opposite event to el Nino?
La Nina is the opposite of El Nino, generally observed as frigid ocean temperatures in the Equatorial Pacific.
- From your observations of the 2015-2016 El Nino event, what sea surface temperature conditions may be present during a La Nina event?
Step 7: Click the checkbox to the left of the layer name, Sea Surface Temperature Anomaly: January 2008.
Step 8: Analyze your observations.
