
2.3 China’s Population Demographics
Understanding Population Pyramids
The most important demographic characteristic of a population is its age-sex structure. When geographers want to examine the structure of a population and the potential for growth in that population, they turn to a fundamental demography tool called the population pyramid. Just as a builder uses a blueprint for depicting the structure of a house, a geographer uses a population pyramid as a blueprint for interpreting the dynamics of the population.
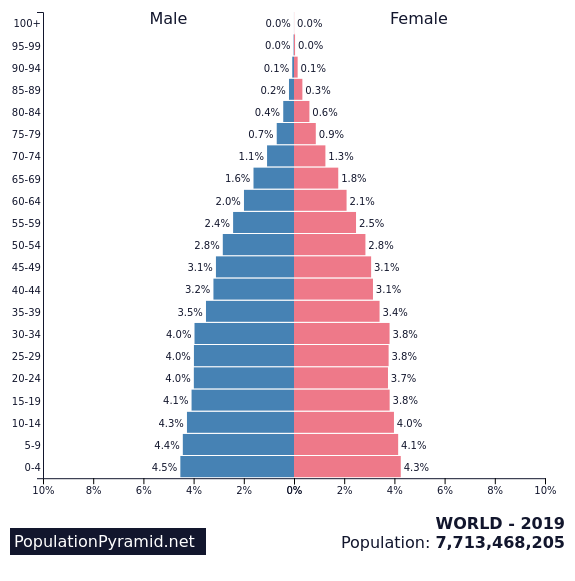
Age-sex pyramids display the percentage or actual amount of the population broken down by gender and age. The five-year age increments on the y-axis allow the pyramid to vividly reflect long-term trends in the birth and death rates and reflect shorter-term baby booms, wars, and epidemics. Population pyramids do the following:
- Graphically display a population’s age and gender composition
- Show numbers or proportions of males and females in each age group
- Reflect population growth or decline
Geographic Questions
- What types of geographic questions can be answered by studying a population’s age and gender composition?
- How do population pyramids provide potential information regarding housing, health and health care, famine and war, and education?
Negative Population Growth
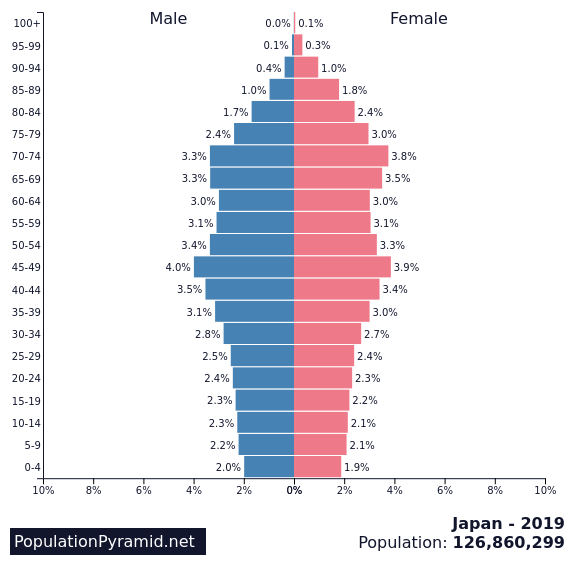
Japan is experiencing a period of negative growth. As negative growth in a country continues, the population is reduced. A population can shrink due to a low birth rate and a stable death rate. Increased emigration (leaving a country) may also contribute to a declining population.
Note how most of the country’s population is in post-reproductive years, the population will decline. As more Japanese retire, and fewer are in the workforce, social programs may begin to be heavily burdened as less tax revenue, and more depend on health care services may cause the country’s national debt to grow to pay for national programs.
Slow Population Growth

The United States’ population is just slightly growing at roughly 1.6 percent per year. This growth rate is reflected in the more square-like structure of the pyramid. There is what is called a “population bulge” in the pyramid between the ages of 50 to 64. This large segment of the population is the post-World War II “baby boom.” As this population ages and climbs up the pyramid, there will be much greater demand for medical and other geriatric services, and increased demand on health care systems.
Study the graph of the United States to analyze the country’s pre-reproductive (ages 0-14), reproductive (ages 15-44), and post-reproductive (ages +45) demographics. Note how low pre-reproductive and moderate reproductive years will slow the growth of the population.
Rapid Population Growth
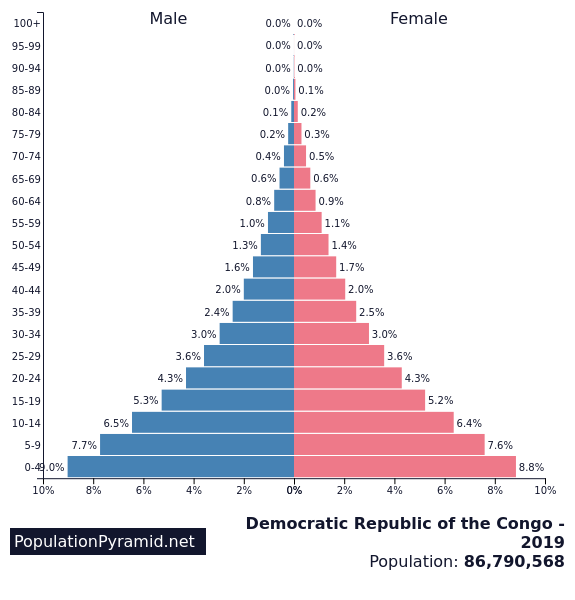
The Democratic Republic of the Congo is experiencing rapid population growth and is visualized as a triangle-shaped pyramid. Typically, countries with wide population pyramid bases have high birth rates and high death rates. Study the graph to understand the country’s pre-reproductive (ages 0-14), reproductive (ages 15-44), and post-reproductive (ages +45) demographics. Note how high pre-reproductive (high crude birth) rates will cause the population to continue to grow rapidly in the coming years.
China’s Population Pyramid
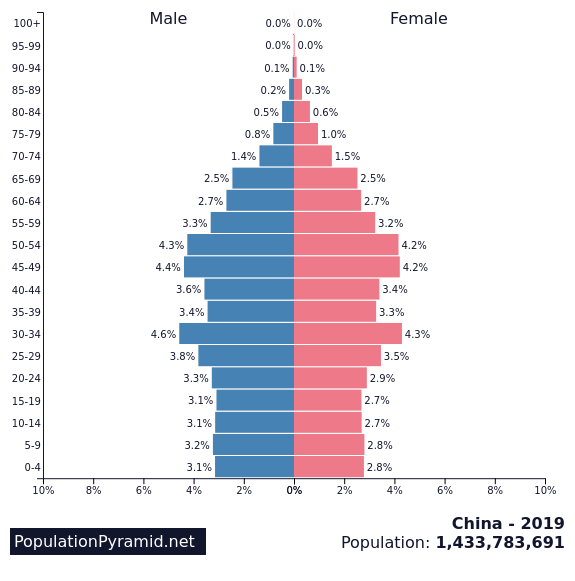
Go to PopulationPyramid.net and search for China. Make sure you are looking at the most current population pyramid to answer the following questions.
Geographic Questions
- What age group in China has the largest number of people?
- What age group in China has the second-largest number of people?
- How many population bulges are there in the pyramid?
- Is more of China’s population under 15 or over 65? (Note: If you place the mouse over the gender of each age group, a raw number will be shown.)
- When should China’s population begin to decline?
- Does the population pyramid show rapid growth, slow growth, zero growth, or negative growth in China?
- Count the total number of males and the total number of females. Are there more males or females in China?
- Are there more males or females in the country’s pre-reproductives?
- Are there more males or females in the country’s reproductive ages?
- Are there more males or females in the country’s post-reproductive ages?
China’s Family Planning Policies
https://youtu.be/eNKQT7Ub2Ps
Geographic Questions
- Explain China’s rationale for the One-Child Policy.” What were some of the social and economic problems that came about because of China’s population control policies? Why did China eliminate the “One-Child Policy?” Why did the Chinese have fewer children than expected after the “One-Child Policy” was discontinued?
Geographic Questions
- Describe why the population of China continues to fall even though the One-Child Policy was discontinued. Explain why the government of China concerned that the population is decreasing too rapidly. Explain how the population pyramid explains China’s growing economy and future potential economic recession. Describe how China’s population policies created the country’s gender imbalance and the implications that have on China’s future.
