
Introduction to Geographic Science
1.5 Population
Demography is the study of how human populations change over time and space. It is a branch of human geography related to population geography, which examines the spatial distribution of human populations. Geographers study how populations grow and migrate, how people are distributed worldwide, and how these distributions change over time.
For most of human history, relatively few people lived on earth, and the world population grew slowly. Only about five hundred million people lived on the entire planet in 1650 (less than half of India’s population in 2000). Things changed dramatically during Europe’s Industrial Revolution in the late 1700s and into the 1800s when declining death rates due to improved nutrition and sanitation allowed more people to survive to adulthood and reproduce. As a result, the population of Europe grew rapidly. However, by the middle of the twentieth century, birth rates in developed countries declined, as children had become a financial liability rather than an economic asset to families. Fewer families worked in agriculture, more families lived in urban areas, and women delayed the age of marriage to pursue education, resulting in a decline in family size and a slowing of population growth. In some countries (e.g., Russia and Japan), the population is in decline, and the average age in developed countries has been rising for decades. The process just described is called the demographic transition.
At the beginning of the twentieth century, the world’s population was about 1.6 billion. One hundred years later, there were roughly six billion people worldwide; as of 2011, the number was approaching seven billion. This rapid growth occurred as the demographic transition spread from developed countries to the rest of the world. During the twentieth century, death rates due to disease and malnutrition decreased in nearly every corner of the globe. In developing countries with agricultural societies, however, birth rates remained high. Low death rates and high birth rates resulted in rapid population growth.
Meanwhile, birth rates and family sizes have declined in most developing countries as people leave agricultural professions and move to urban areas. This means that population growth rates, while still higher in the developing world than in the developed world, are declining. Although the exact figures are unknown, demographers expect the world’s population to stabilize by 2100 and decline somewhat.
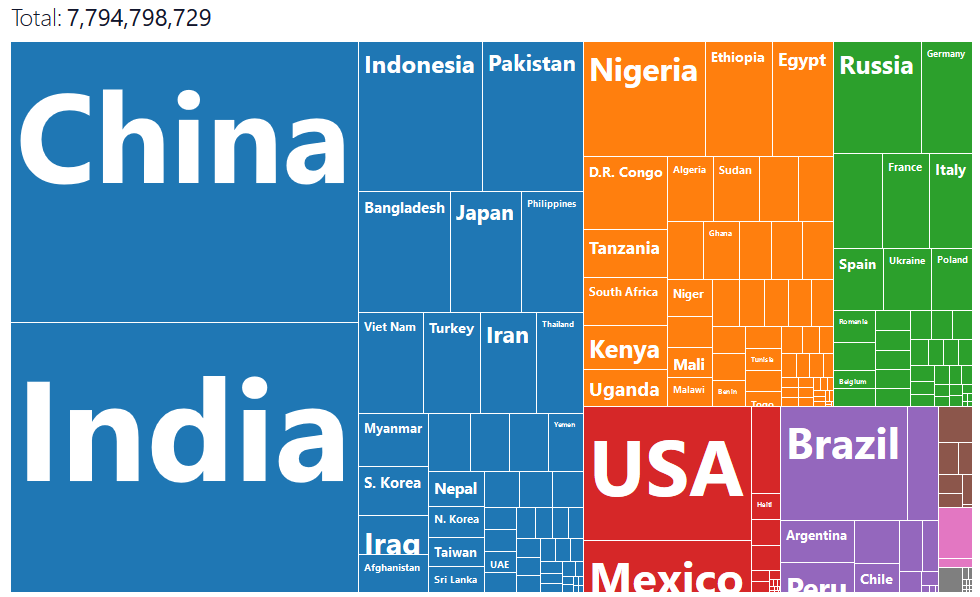
The world’s population growth rate has been mostly occurring in developing countries, whereas populations are stable or declining in Europe and North America. World population increase is pronounced on the continent of Asia: China and India are the most populous countries in the world, each with more than a billion people, and Pakistan is an emerging population giant with a high rate of population growth. The continent of Africa has the highest fertility rates in the world. The most striking paradox within population studies is that while there has been a decline in fertility (a declining family size) in developing countries, the world’s population will grow substantially by 2030 because of the compounding effect of a large number of people already in the world. Even though population growth rates are in decline in many countries, the population is still growing. A small growth rate on a broad base population still results in the birth of many millions of people.
As of January 2023, the United States Census Bureau estimates that the world population is reached 8 billion, with a growth rate of roughly 1.07 percent, or roughly 82 million people per year. The world population reached 6 billion in 1999 and 7 billion in 2011. If the current growth rate continues, the human population will reach 8 billion by 2023 and hopefully level off at roughly 10 billion by 2055. Between 2010 and 2050, world population growth will be generated exclusively in developing countries.
The world’s three most significant population clusters are the regions of eastern China, South Asia, and Europe. Southeast Asia also has large population clusters. Additional large population centers exist in various countries with high urbanization. An example is the urbanized region between Boston and Washington, DC, which includes New York City, Philadelphia, Baltimore, and neighboring metropolitan areas, often called megalopoleis. The coastal country of Nigeria in West Africa and the island of Java in Indonesia are good examples of large population clusters centered in the tropics.
Social and environmental dynamics and geography will determine where humanity will live. Providing food, energy, and materials in areas where populations continue to grow will tax many countries, and poverty, malnutrition, and disease are expected to increase in regions with poor sanitation, limited clean water, and a lack of economic resources. According to the World Bank, extreme poverty had declined for over three decades. But when the pandemic hit in 2020, that trend changed for the worst. The number of people in extreme poverty rose from 70 million to more than 700 million. The global extreme poverty rate reached 9.3 percent, up from 8.4 percent in 2019. However, in 2022, the world population passed 8 billion. Moreover, the planet’s carrying capacity is not and cannot be known. How many humans can the earth sustain indefinitely? We may have already reached the threshold of its carrying capacity.
The human population will continue to grow until it either crashes due to the depletion of resources or stabilizes at a sustainable carrying capacity. Population growth exacts a toll on the earth as more people use more environmental resources. The areas most immediately affected by increased populations include forests (a fuel resource and a source of building material), freshwater supplies, and agricultural soils. These systems get overtaxed, and their depletion has serious consequences. Type C climates, moderate and temperate, are usually the most productive and are already vulnerable to severe deforestation, water pollution, and soil erosion. Maintaining adequate food supplies will be critical to supporting a sustainable carrying capacity. The ability to transport food supplies quickly and safely is a significant component of managing the conservation of resources. Deforestation by humans using wood for cooking fuel is already a severe concern in arid type B climates.
Population Demographics
The Industrial Revolution, which prompted the shift in population from rural to urban, also encouraged market economies, which have evolved into modern consumer societies. Various theories and models have been developed to help explain these changes. For example, in 1929, the American demographer Warren Thompson developed the Demographic Transition Model (DTM) to explain population growth based on an interpretation of demographic history. A revised version of Thomson’s model outlines five stages of the demographic transition from traditional rural societies to modern urban societies.

Stage 1: Low Growth Rate
Humans have lived in the first stage of the DTM for most of our existence. In this first stage, CBRs and CDRs fluctuated wildly regionally, globally, and over time because of living conditions, food output, environmental conditions, war, and disease. Ultimately, the natural increase of the world was stable because CBRs and CDRs were about equal. However, around 8,000 BC, the world’s population grew dramatically due to the agricultural revolution. During this time, humans learned to domesticate plants and animals for personal use and became less reliant on hunting and gathering for sustenance. This allowed for more stable food production and allowed village populations to grow. However, war and disease prevented population growth from occurring globally.
Stage 2: High Growth Rate
Around the mid-1700s, global populations grew ten times faster than in the past because of the Industrial Revolution. The Industrial Revolution brought with it a variety of technological improvements in agricultural production and food supply. Increased wealth in Europe and later North America because the Industrial Revolution meant more money and resources could be devoted to medicine, medical technology, water sanitation, and personal hygiene. Sewer systems were installed in cities; thus, public health improved. All of this dramatically caused CDRs to drop around the world. At first, CBRs stayed high as CDRs dropped, causing populations to increase in Europe and North America. Over time, this would change.
Africa, Asia, and Latin America moved into Stage 2 of the demographic transition model 200 years later for different reasons than their European and North American counterparts. First, the medicine created in Europe and North America was brought into these developing nations creating what is now called the medical revolution. This revolution or diffusion of medicine to this region caused death rates to drop quickly. However, while the medical revolution reduced death rates, it did not bring with it the wealth and improved living conditions, and development that the Industrial Revolution created. As a result, global population growth is most significant in the regions still in Stage 2.
Stage 3: Moderate Growth Rate
Today, Europe and North America have moved to Stage 3 of the demographic transition model. A nation moves from Stage 2 to Stage 3 when CBRs begin to drop while CDRs remain low or continue to fall. It should be noted that the natural rate of increase in nations within Stage 3 is moderate because CBRs are somewhat higher than CDRs. The United States, Canada, and European nations entered this stage in the early 20th century. Latin American nations entered this stage later in the century.
Advances in technology and medicine cause a decrease in IMR and overall CDR during Stage 2. Social and economic changes bring about a decrease in CBR during Stage 3. Countries that begin to acquire wealth tend to have fewer children as they move away from rural-based development structures toward urban-based structures because more children survive in childhood. As a result, the need for large families for agricultural work decreases. Additionally, women gained more legal rights and chose to enter the workforce, own property, and have fewer children as nations moved into Stage 3.
Stage 4: Return to Low Growth Rate
A country enters Stage 4 of the demographic transition model when CBRs equal to or become less than CDRs. When CBRs are equal to CDRs, a nation will experience zero population growth (ZPG). This occurs in many countries where girls do not live as long as they reach their childbearing age due to gender inequality.
A country in the first two stages of the transition model will have a broad base of young people and a smaller proportion of older people. A country in Stage 4 will have a much smaller base of young people (fewer children) but a much larger population of elderly (decreased CDR). A country with a large youth population is more likely to be rural with high birthrates and possibly high death rates, helping geographers analyze a nation’s health care system. Moreover, a country in Stage 4 with a large elderly population will have fewer young people supporting the economy. These two examples represent the dependency ratio mentioned earlier in this chapter. This ratio is the number of young and older adults dependent on the working force.
Human geographers like to focus on the following demographic groups: 0-14 years old, 15-64 years old, and 65 and older. Individuals ages 0-14 and over 65 are considered dependents (though this is changing in older generations). One-third of all young people live in developing nations. Moreover, this places considerable strain on those nations’ infrastructure, such as schools, hospitals, and daycare. Older individuals in more developed nations (MDL) benefit from health care services but require more help and resources from the government and the economy.
Another ratio geographers look at is the number of males compared to females, called the sex ratio. Globally, more males are born than females, but males have a higher death rate than females. However, understanding a country’s sex and dependency ratios helps human geographers analyze fertility rates and natural increases. As noted earlier, population growth has increased dramatically in the last century. However, every country is still in Stage 1, and only a few have moved into Stage 4. Most of the world is either in Stage 2 or 3, which both have higher CBRs than CDRs, creating a human population of over 7.5 billion today.
Stage 5: Population Decline
Many demographers believe a new stage in the DTM should be added to address issues starting to develop in countries within Europe and Japan. In this final stage, CBR would be extremely low and an increasing CDR. This would cause the area’s NIR to be negative, leading to declining population growth. This may create an enormous strain on a country’s social safety net programs as it tries to support older citizens who are no longer working and contributing to the economy.
Urbanization and Family Size
As countries move from an agricultural to an industrial economy, there is a significant shift in population from rural to urban settings. The Industrial Revolution of the nineteenth century ushered in significant technological developments and changes in labor practices, which encouraged migration from the farm to the city. Because of increased mechanization, fewer farm workers are needed to produce larger agricultural yields. At the same time, factories in urban areas greatly need industrial workers. This shift continued into the information age of the late twentieth century and continues in many parts of the developing world in the current century.
A fundamental principle of population growth that addresses this rural-to-urban shift states that as countries industrialize and urbanize, family size typically decreases, and incomes traditionally increase. Though this may not be true in all cases, it is a general principle consistent across cultural lines. Agricultural regions generally have a larger average family size than their city counterparts. The fertility rate is the average number of children a woman in a particular country has in her lifetime, whether or not they all live to adulthood. If a given country’s fertility rate is less than 2.1 (the replacement level), the population of that country is in decline unless there is significant immigration. A fertility rate above 2.1 indicates that the country’s population is increasing. Some children will never reach reproductive age nor have children of their own, so the replacement rate has to be slightly higher than 2. The concept of fertility rate is slightly different from the term family size, which indicates the number of living children raised by a parent or parents in the same household.
https://www.youtube.com/watch?time_continue=28&v=2LyzBoHo5EI&feature=emb_logo
Population Demands
A country’s demographic statistics can be illustrated graphically by a population pyramid. A population pyramid is two bar graphs that depict male and female age cohorts in absolute size or as a percentage of the total population. Male cohorts are typically shown on the left side of the pyramid, and females on the right.
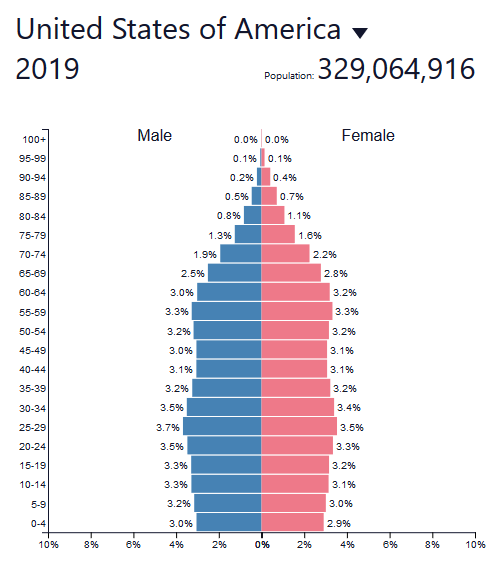
The shape of a country’s population pyramid tells a story about the history of its population growth. For example, a high-growth-rate country has a pyramid that is narrow at the top and wide at the bottom, showing that every year more children have been born than the year before. As family size decreases and women in society have fewer children, the shape of the pyramid changes. A population pyramid for a post-industrialized country with negative growth would be narrower at the bottom than in the middle, indicating fewer children than middle-aged people. Four basic shapes indicate the general trends in population growth:
- Rapidly expanding (example as of 2023 – Africa)
- Expanding (example as of 2023 – World)
- Stationary (example as of 2023 – South America)
- Contracting (examples as of 2023 – Europe, China,and Japan)
These shapes also illustrate the percentage of a population under the age of fifteen or over the age of sixty-five, which are standard indicators of population growth. Many post-industrial countries have a negative population growth rate. Their population pyramids are narrow at the bottom, indicating an urbanized population with small family sizes.
