
Phylogeny – Background
Taxonomy and Phylogenetic Trees
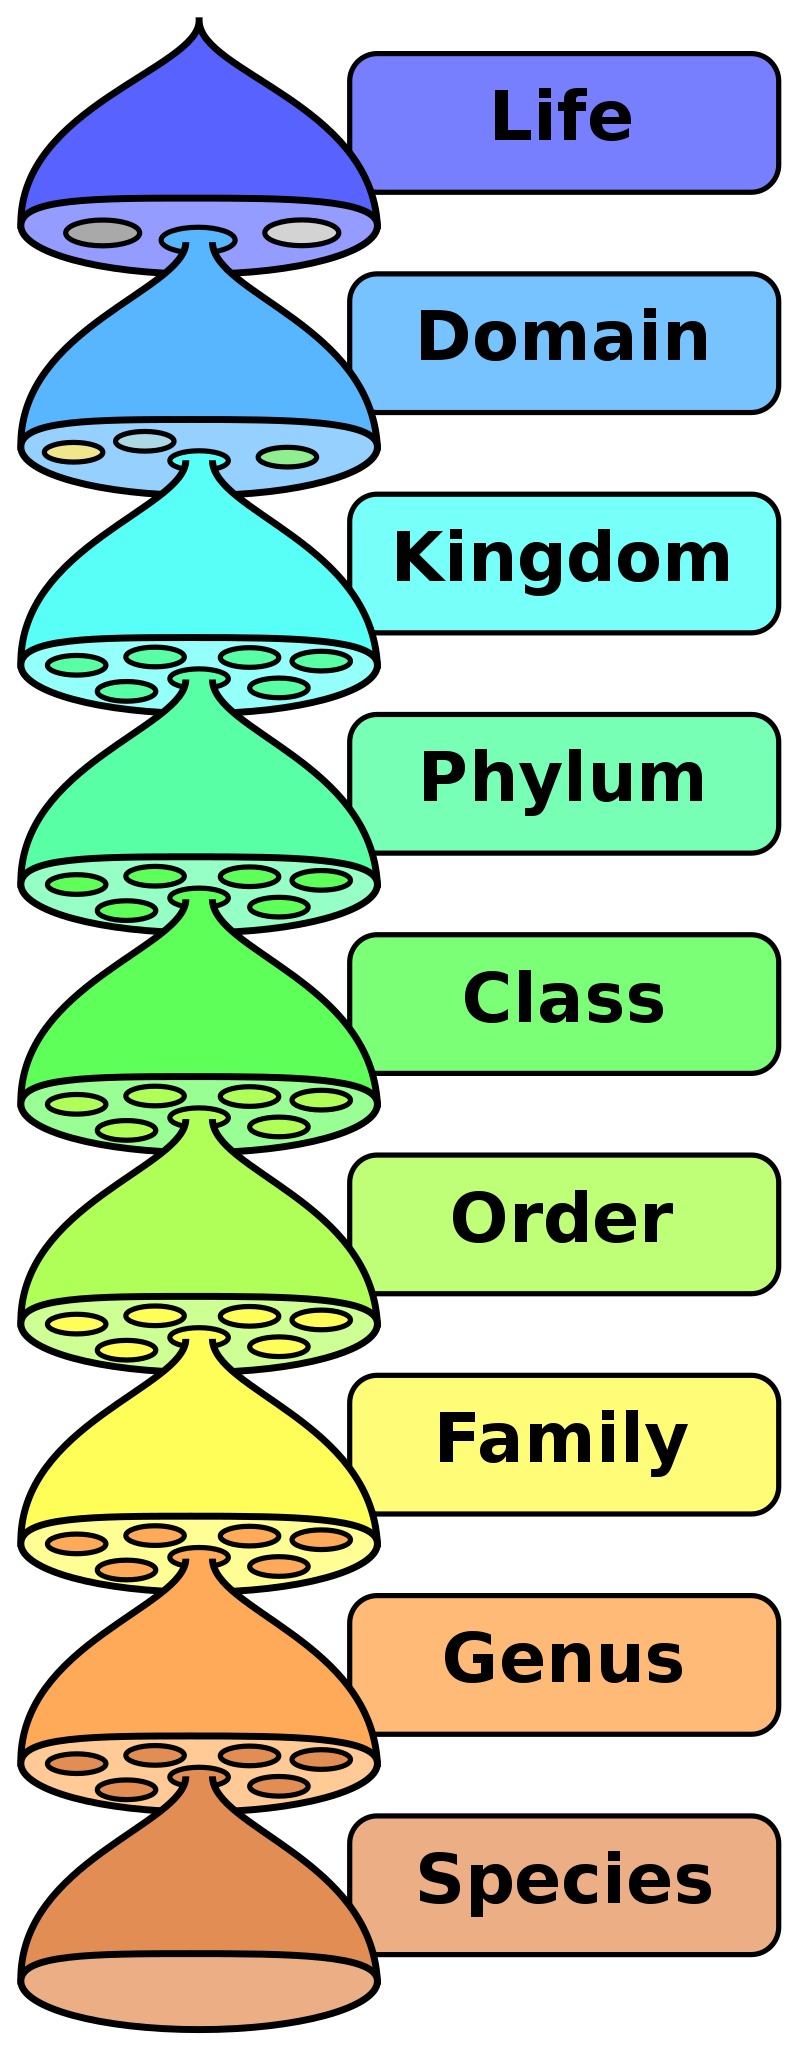
Taxonomy is the science of classifying organisms. Biologists use similarities to group organisms into species, genera, families, orders, classes, phyla, kingdoms, and domains. Humans have practiced taxonomy for thousands of years by grouping organisms with similar traits together. Today, modern biologists use phylogeny, the evolutionary history of organisms, to inform taxonomy. In other words, we want to group organisms with shared common ancestors together.
A phylogeny is a hypothesis of the evolutionary history of a group of organisms. We cannot directly observe events that happened in the past. However, we can observe traits that are shared between extant groups and use these to form and test hypotheses of relatedness. Biologists use morphology, fossils, and molecular similarity to classify organisms. Most phylogenetic reconstructions today rely on molecular data.
Phylogenetic trees are illustrations of phylogenies. There are several methods for drawing a phylogenetic tree. The most commonly used method today is cladistics, which tries to represent the best hypothesis of the evolutionary history of a clade, or group of organisms derived from a common ancestor.
Reading Phylogenetic Trees
Phylogenetic trees can take a number of forms that convey the same information. Consider, for instance, a tree depicting the relationship between the three domains of life – Bacteria, Archaea, and Eukarya. Molecular evidence suggests that Archaea and Eukarya are more closely related to each other than either group is to Bacteria. Six of the many ways to represent this information are shown in the figure below. Note that each of these trees is identical in terms of the information it conveys.

Trees can have proportional branch lengths, meaning that the length of the branch represents a particular length of time or a certain amount of genetic change. Many trees, however, do not have proportional branch length, and represent relationships without making any claim about time or genetic distance.
Trees can be rooted or unrooted. An unrooted tree shows the relationships between organisms without indicating the common ancestor. A rooted tree shows the common ancestor of all of the taxa shown in the tree. The common ancestor may be theoretical – that is, if the hypothesis shown in the phylogenetic tree is correct, it must have existed, even if it is not represented in the fossil record. In the rooted tree below, the root would be LUCA, the last universal common ancestor.

Often, but not always, the most distant past is shown at the bottom or left-hand side of the phylogeny. Each node represents a divergence. Usually, if the tree depicts taxa that are different species or a higher order taxonomic group, each node represents a speciation event. In the tree below, node 1 is the earliest speciation event, and node 4 is the most recent.

Note that branches can be rotated around a node and show the same information. For instance, the two trees below show the same phylogeny, even though the branches of taxa C, D, and E have been rotated around nodes 3 and 4.

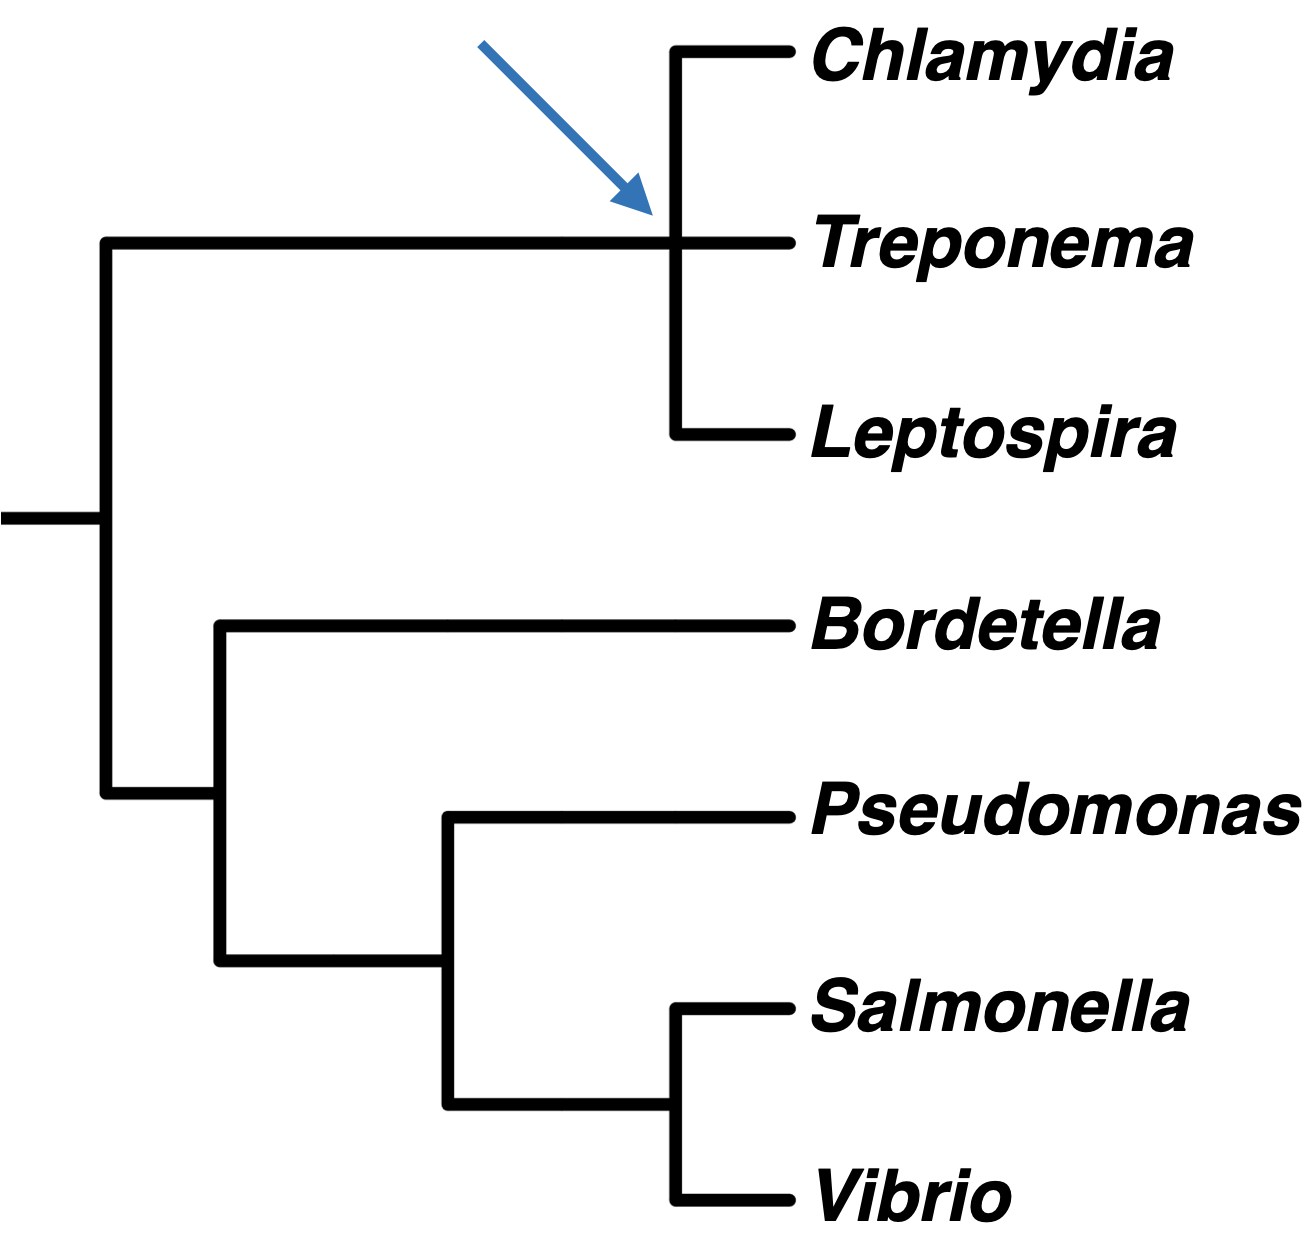
Sometimes, it is not possible to resolve evolutionary relationships into dichotomously branching trees. We represent this with a polytomy, or a node with three or more branches, as in this phylogenetic tree showing bacterial genera. Polytomies can also indicate that three or more groups radiated from the same ancestral population, but it is more commonly used to represent uncertainty regarding the best tree topology.
Using Phylogeny to inform Taxonomy
A guiding principle of cladistics is that a valid clade must be monophyletic, meaning that it includes a common ancestor and all of its descendants. The common ancestor might be known, or it may be theoretical. A clade can be at any level of taxonomy – species, genus, family, etc. – and it can consist of living or extinct organisms, or both.
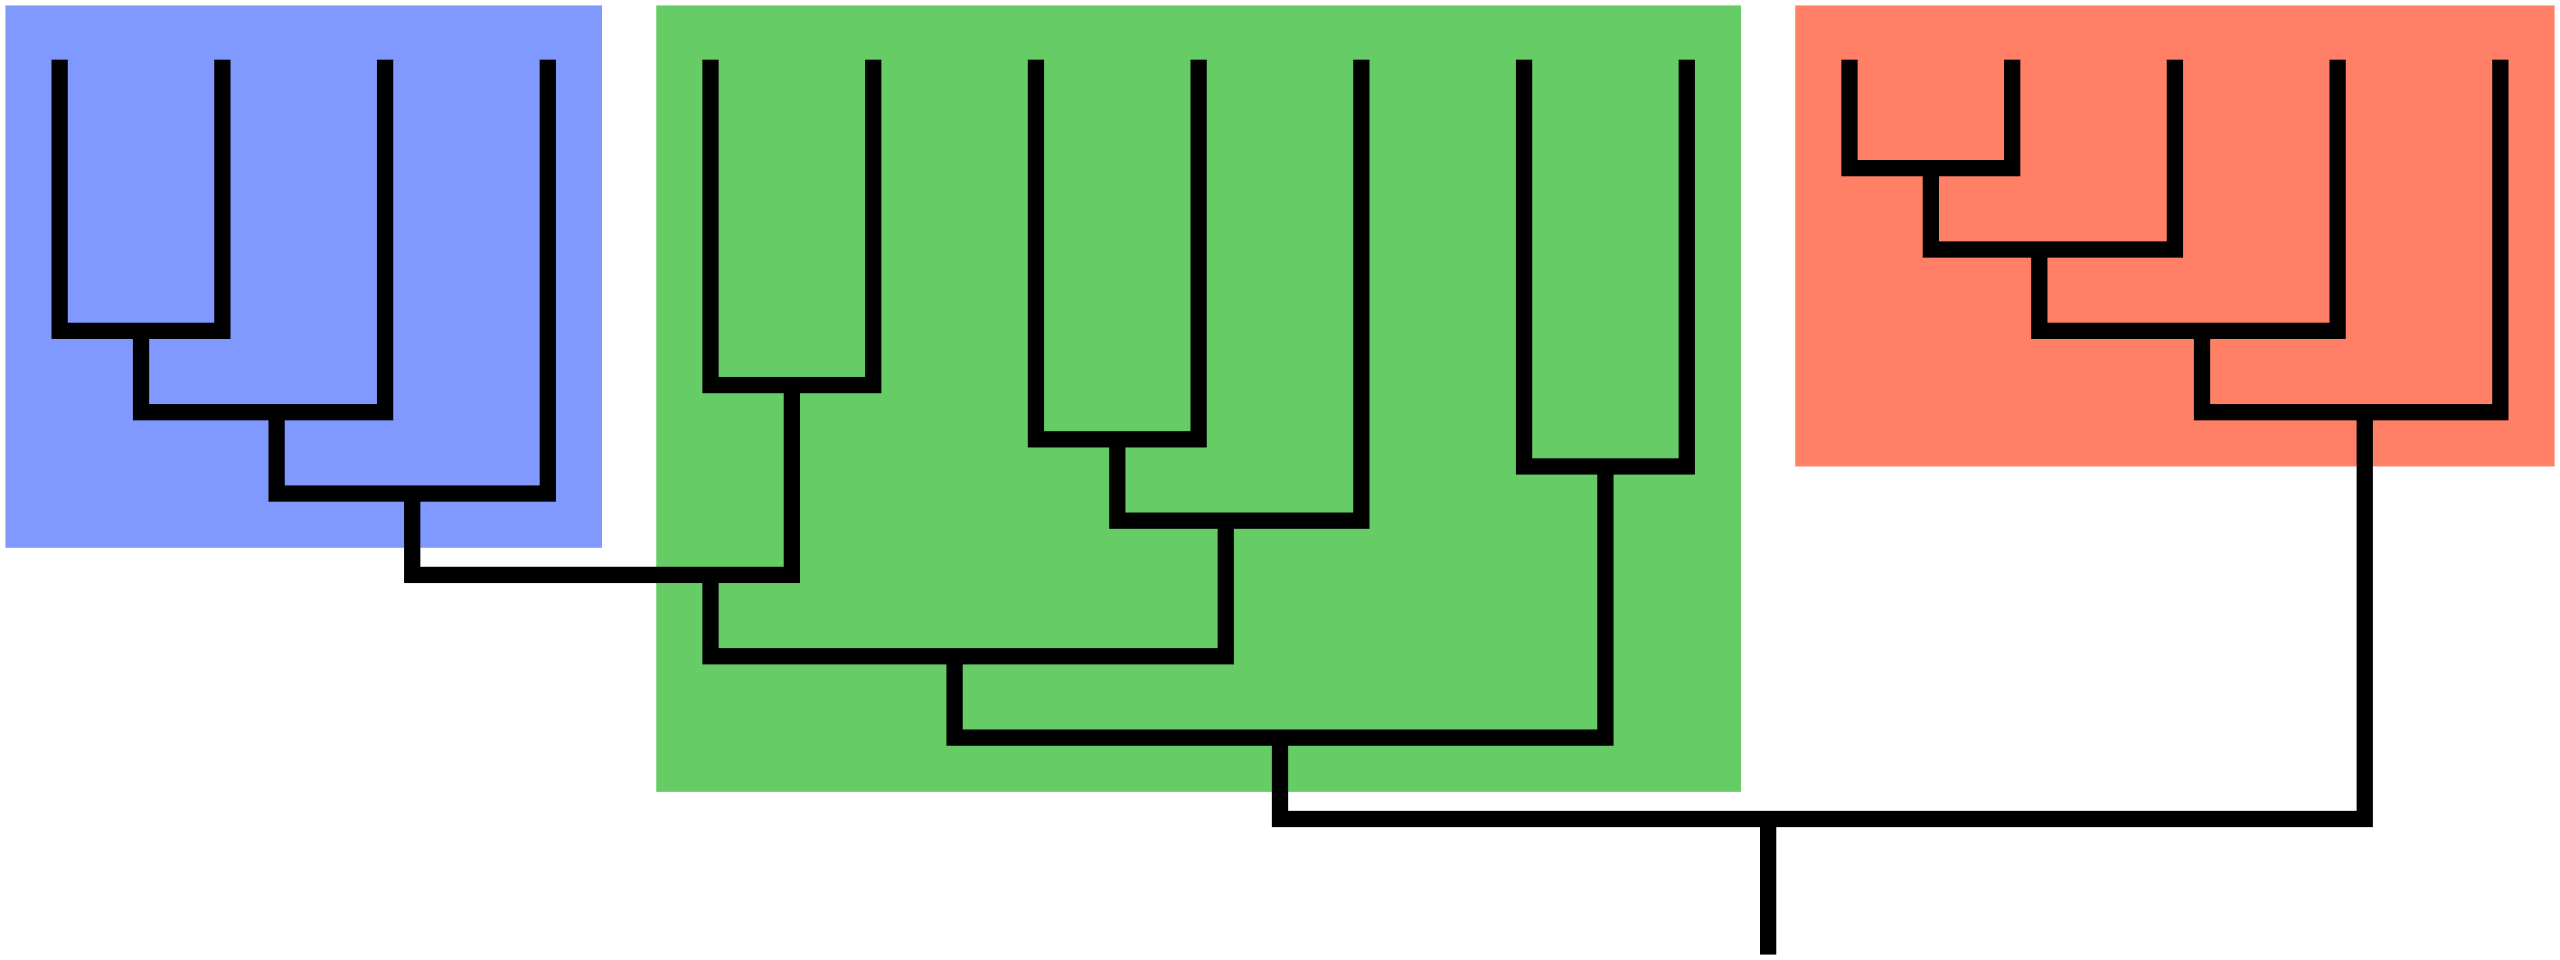
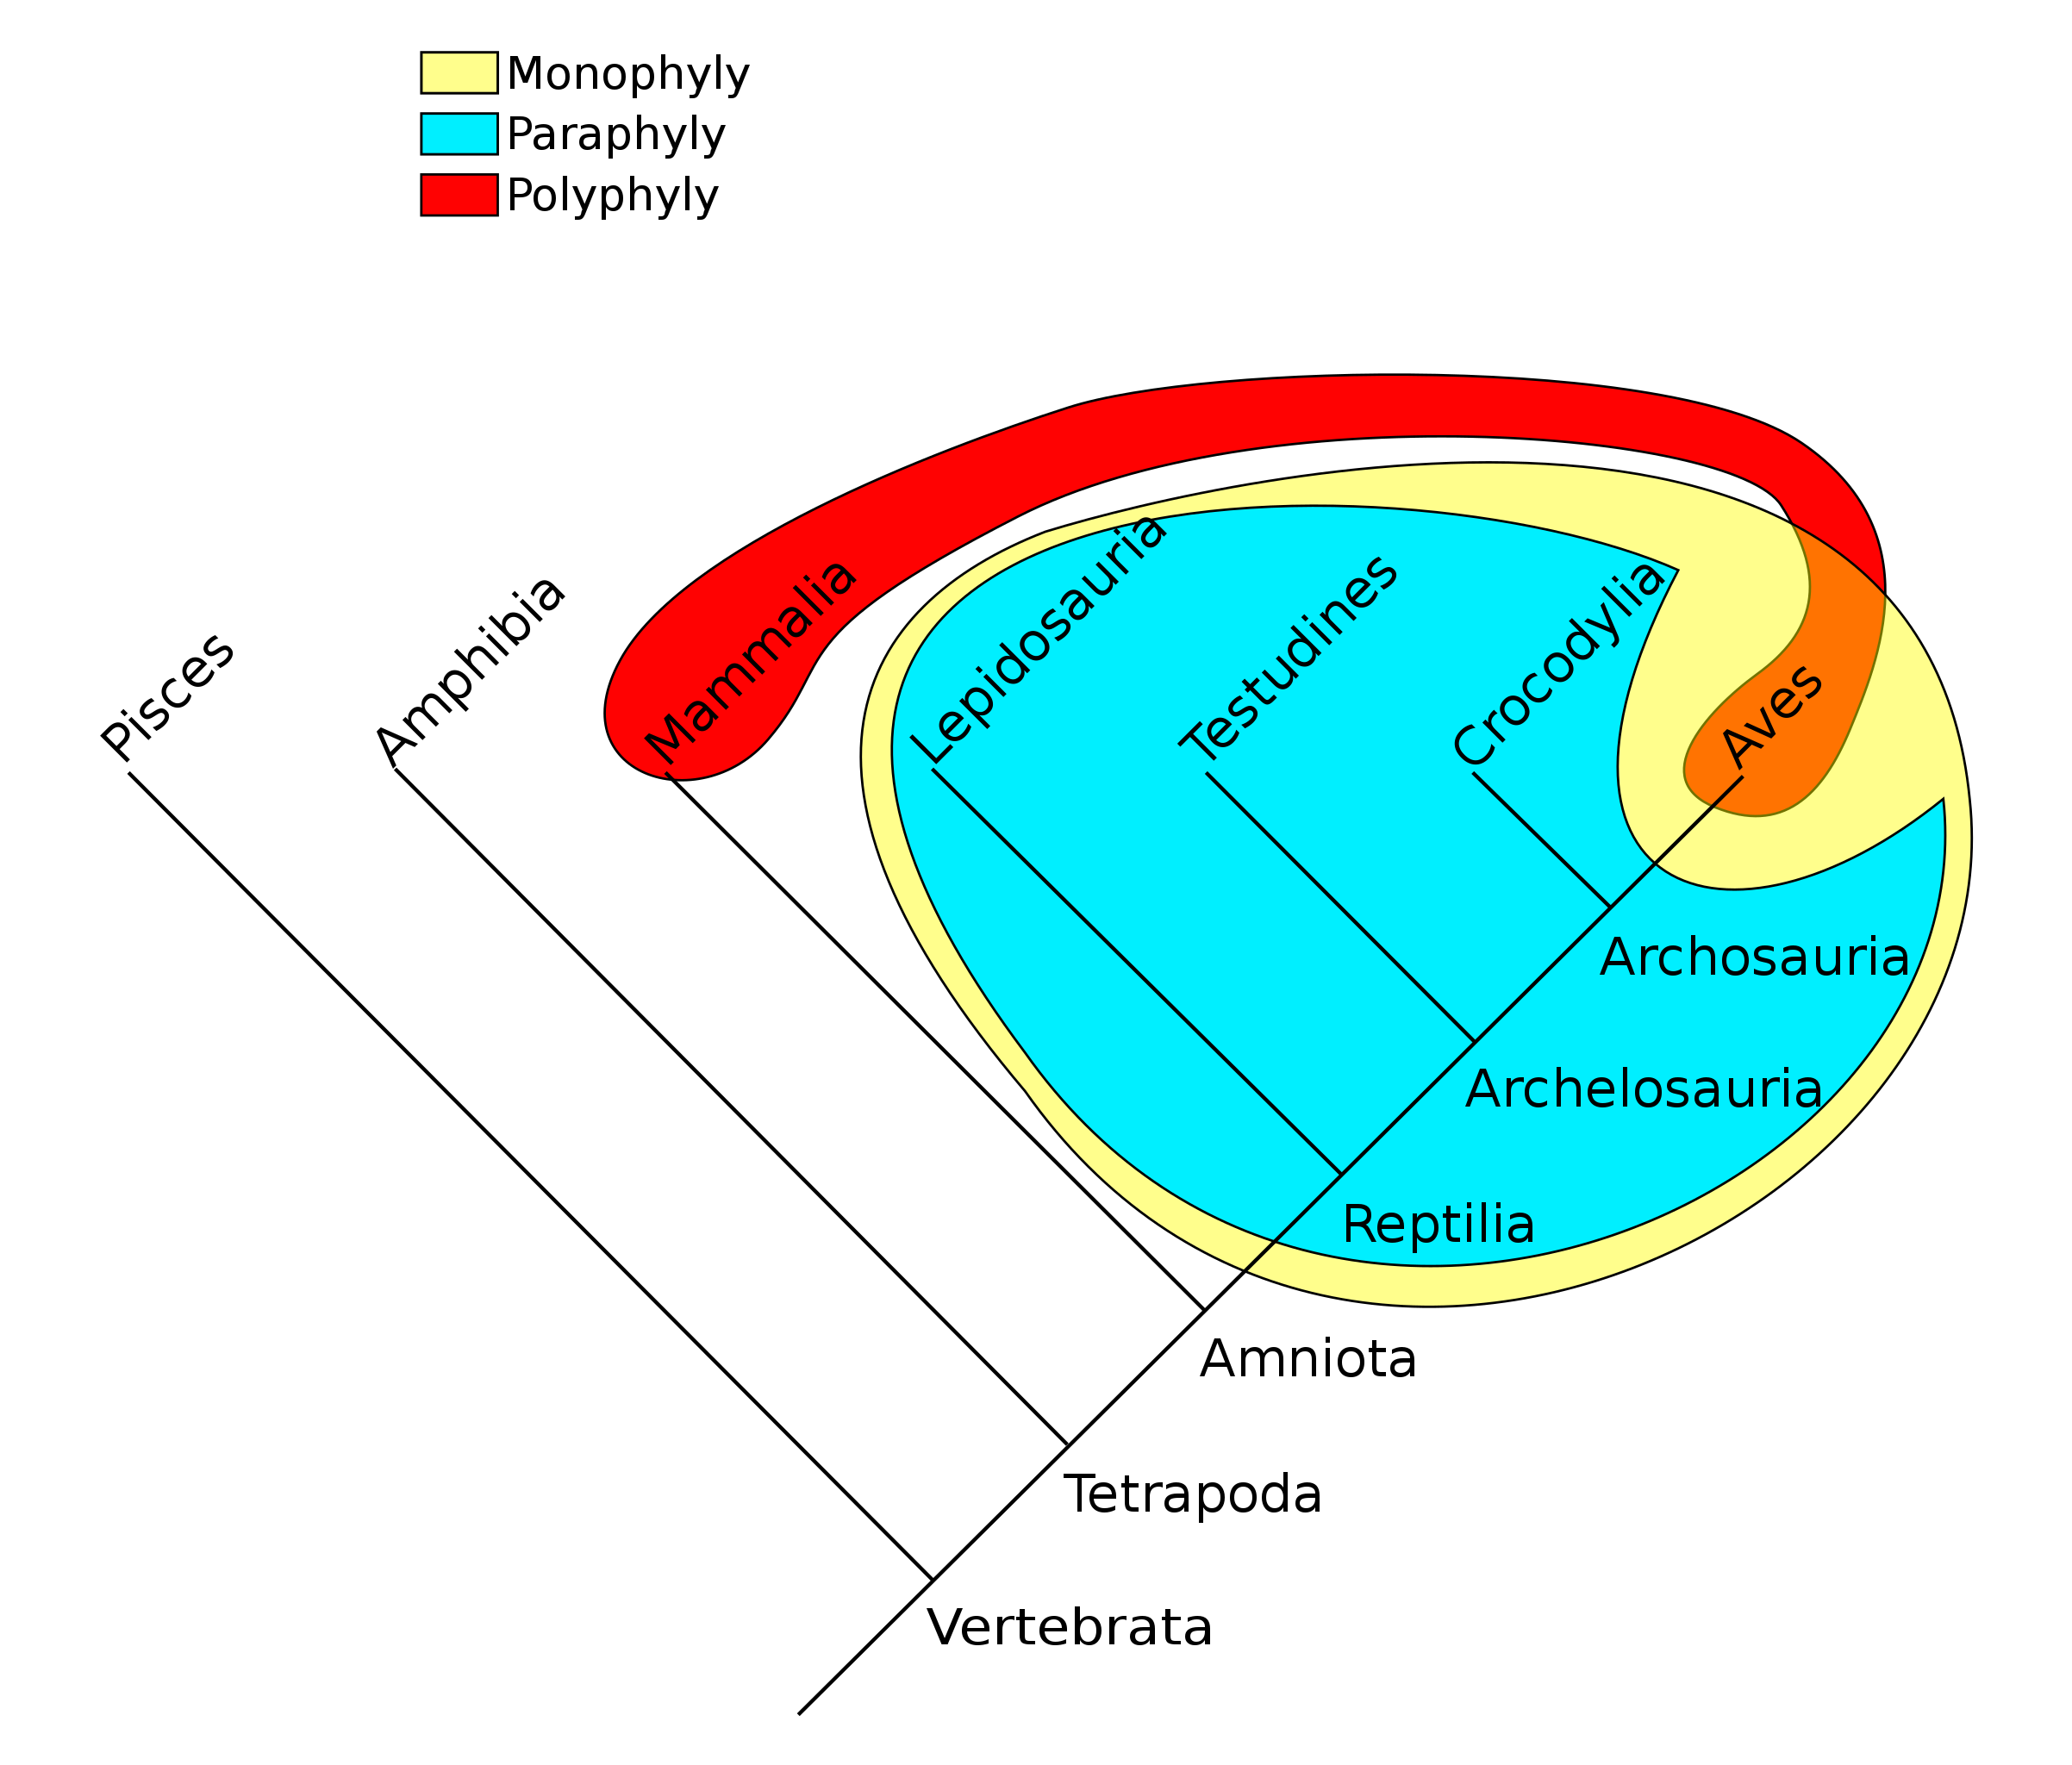
The group shown in green is a paraphyletic group, which includes a common ancestor and some, but not all, of its descendants. Taxonomists today try to avoid naming groups that are paraphyletic. This has resulted in revisions of many taxa that were previously widely accepted. For example, reptiles must include the birds to be a valid clade. Excluding the birds by distinguishing between Class Reptilia and Class Aves results in paraphyly. Polyphyletic groups should also be avoided. A polyphyletic group includes taxa that do not share an immediate common ancestor. Grouping all plants with C4 photosynthesis, for instance, would result in a polyphyletic group. Likewise, grouping mammals and birds together due to the shared trait of homeothermy (“warm-bloodedness”) results in a polyphyly.
Reconstructing Phylogenies
Ideally, phylogenies are reconstructed using homologous traits, which are similar between organisms due to shared ancestry. We refer to traits or characteristics as characters when discussing phylogeny. Morphological characters can be homologous. For example, seeds are a trait shared by some plants, as indicated on the phylogenetic tree. Seeds are a homology shared by magnolias and conifers, but not by ferns or mosses.
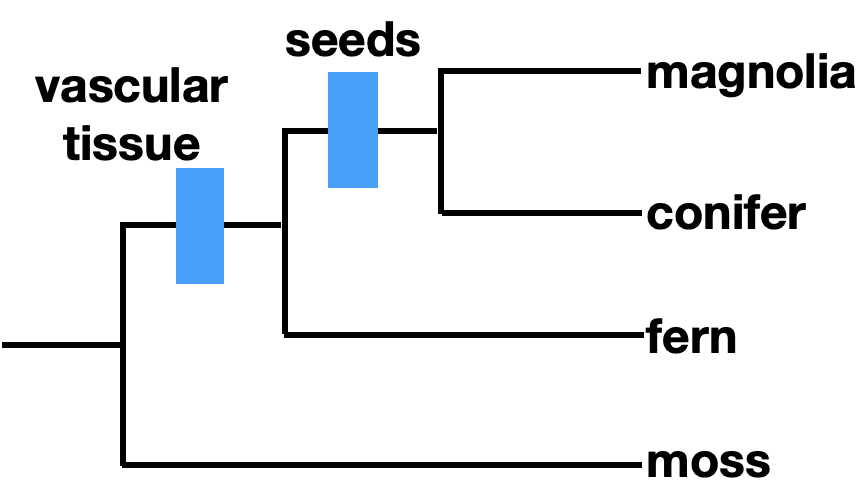
We can refer to characters as ancestral or derived. An ancestral character, or plesiomorphy, was present in a common ancestor, while a derived character, or apomorphy, differs from the ancestral form. In this case, seeds are a derived character, and lack of seeds is an ancestral character. How do we know if a character is ancestral or derived? Sometimes the fossil record can provide this information. Otherwise, we rely on outgroup analysis. An outgroup is a group of organisms that is relatively closely related to the taxa you are studying.
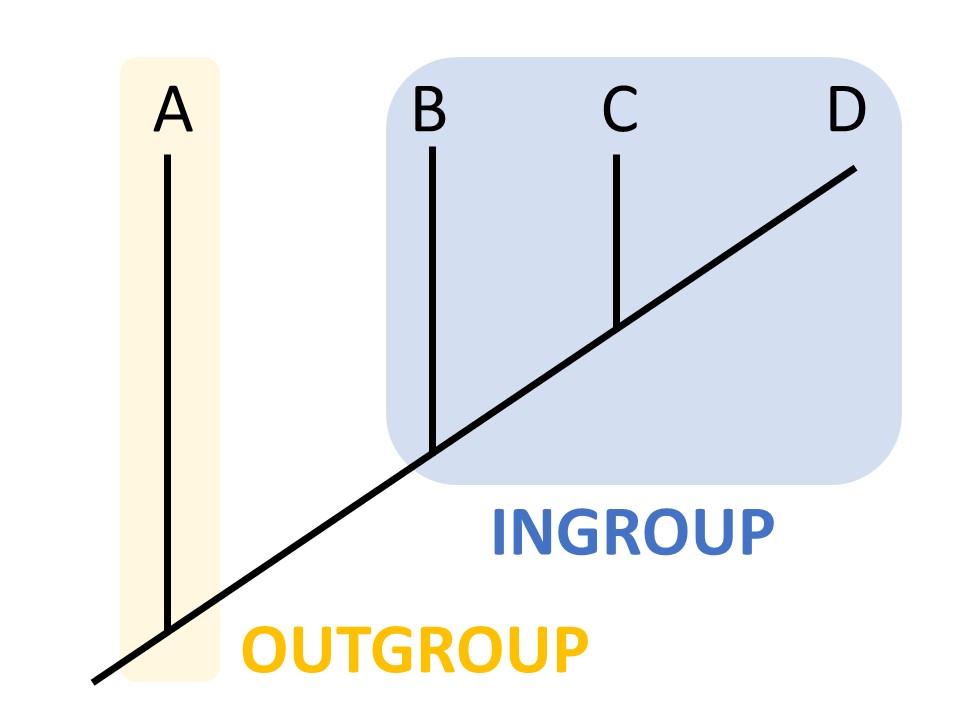
By comparing characters between the ingroup and outgroup, we can often determine whether a character is ancestral or derived.
Phylogenetic trees can be inferred by grouping organisms with shared derived characters together. Shared derived characters, or synapomorphies, distinguish a group from other taxa. Monophyletic groups are thus defined by their synapomorphies.
However, not all shared characters are synapomorphies. A character which is similar in two groups but was not inherited from a common ancestor is called a homoplasy. This is often due to convergent evolution. An example of convergent evolution is the camera-like eyes of vertebrates and cephalopods. Despite the similarity in eye structure, camera-like eyes evolved independently in these two groups, which are not closely related. Another example is C4 photosynthesis, which has evolved independently at least 62 times in flowering plants.
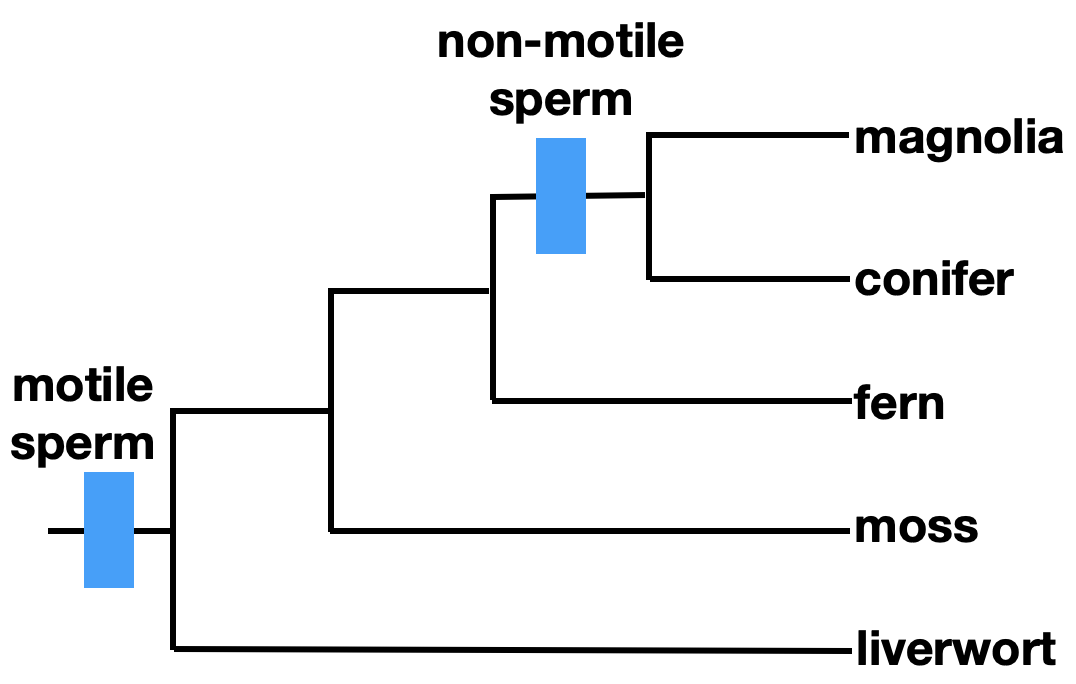
Additionally, it is important to note that traits can be lost. In the phylogeny shown above, motile sperm is an ancestral character that is shared by liverworts, mosses, and ferns. It is a symplesiomorphy, a shared ancestral character. Using this trait to define a taxonomic group of ferns, mosses, and liverworts would result in a paraphyletic grouping, which is not acceptable in modern taxonomy.
How to draw a phylogenetic tree
Let’s examine land plants and a few of their close relatives to demonstrate reconstruction of phylogenies. For this tree, we will use parsimony to reconstruct the best phylogenetic tree. Parsimony simply means that we choose the simplest explanation that fits the evidence. In the context of phylogenetic trees, we draw the tree with the fewest number of evolutionary changes. The most parsimonious tree is not always the correct tree, particularly when analyzing molecular data, but it is a good place to start. Keep in mind that traits can be lost as well as gained. For instance, ratites, such as ostriches, emus, and rheas, are birds that have lost the ability to fly.
The first step in phylogenetic analysis is choosing the taxa to study. The second step is choosing characters that are, to the best of your knowledge, synapomorphies. For this exercise, the taxa and characters are presented in the table. In this table, 1=presence of character; 0=absence. This could also be indicated by +/-, or by a description of the character.
Table of characters of charophytes and relatives[1]
| glycolate oxidase | flagella on vegetative cells | branching | plasmodesmata | Alternation of generations | |
| Land plants | 1 | 0 | 1 | 1 | 1 |
| Coleochaete | 1 | 0 | 1 | 1 | 0 |
| Spirogyra | 1 | 0 | 1 | 0 | 0 |
| Closterium | 1 | 0 | 1 | 0 | 0 |
| Chlorokybus | 1 | 0 | 0 | 0 | 0 |
| Mesostigma | 1 | 1 | 0 | 0 | 0 |
| Volvox | 0 | 1 | 0 | 0 | 0 |
- Begin by drawing a tree that separates the outgroup from all the taxa in the ingroup. Add any shared characters of the ingroup to the tree in the correct position.

- Now find the derived character shared by the most number of taxa in the ingroup. In this case, loss of flagella on vegetative cells is the next most ancestral character.

- Continue this process with each character. If two taxa have the same characters, they should be placed as sister taxa in your tree.

Note that this character matrix has no conflicts, and there is only one best tree. In real life, there are often characters that are homoplasies, which can give conflicting information and make tree reconstruction significantly more difficult.
Moreover, for extant species, the preferred way to reconstruct phylogenies is to use molecular data. DNA and protein sequences can be compared between organisms, and the differences between sequences allow evolutionary biologists to determine relatedness with a much higher degree of precision than can be achieved using morphological or behavioral characters. This is because sequences have much more data than morphological characters (every nucleotide or amino acid is a separate character, and with modern genomics we can now compare hundreds of thousands of nucleotides or amino acids between species). Moreover, it is more reliable because morphology and behavior can exhibit convergent evolution, meaning that traits can arise independently in distantly related groups. This is much less of a problem with molecular data.
[1] Adapted from: Cédric Finet, Ruth E. Timme, Charles F. Delwiche, Ferdinand Marlétaz. (2010) Multigene Phylogeny of the Green Lineage Reveals the Origin and Diversification of Land Plants. Current Biology, Volume 20 (24):2217-2222.
the science of classification of organisms
the evolutionary history of organisms
still in existence (as opposed to extinct)
a diagram that represents a hypothesis about the evolutionary relationships between organisms
a method of classifying organisms based on common ancestry; uses shared derived characteristics to form groups
a monophyletic group; a group composed of a common ancestor and all of its descendents
the process by which new species form
a branch point with more than three branches diverging from it
a monophyletic group consists of a common ancestor and all of its descendents
a paraphyletic group includes a common ancestor and some, but not all, of its descendants
a polyphyletic group is a group with different ancestors; usually grouped according to homoplasies
trait that is shared due to shared ancestry
similarity due to shared ancestry; inherited from a common ancestor
an ancestral character that is homologous within a particular group of organisms but not unique to the group. Therefore it cannot be used as a defining character of the group.
a derived or changed character that has evolved from its ancestral form. Apomorphies are unique to a particular clade and can be used to define groups.
a group that can serve as a reference group to the taxa being studied; closely related but not belonging to the taxa being studied
a shared derived character; a trait that is shared by two or more taxa due to common ancestry. Synapomorphies can be used to define monophyletic groups
a trait that is shared between two groups, but NOT because of common ancestry.
when two groups independently evolve similar traits
an ancestral character that is shared by organisms due to shared ancestry, but does not distinguish the group from other groups.
a principle that the best tree is the one that requires the fewest number of changes (in the absence of other empirical evidence)
