
7.2 Lab Protocol
Approximate Time: 3 hours
Learning Objectives
-
- Key Terms in Muscle Physiology: Define muscle fiber, motor unit, sarcoplasmic reticulum (and its relationship to Ca2+ release), T-tubule, threshold stimulus, and tetanus, isometric contraction, and isotonic contraction.
- Phases of a Muscle Twitch: Describe the different phases of a muscle twitch (latent phase, contraction phase, and relaxation phase).
- Types of Muscle Contractions: Understand the difference between isometric and isotonic contractions.
- Electromyograms: Record and understand electromyograms (EMGs).
- Muscle Fatigue: Understand the effects of muscle fatigue on contraction and relaxation. Understand how increasing the load on a muscle affects various physiological factors during contraction, including force production, motor unit recruitment, and muscle fatigue.
- Summation and Tetanus: Differentiate between incomplete summation and tetanus.
- POPS Project: Abstract section due.
EMG cable and Hand Dynamometer Setup
- Locate the ROAM EMG and FT-220 hand dynamometer.
- The FT-220 dynamometer should be already plug into Channel A2 input of the IXTA.
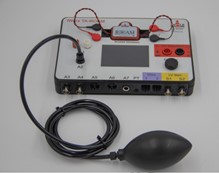
Figure 1: The EMG cable and hand dynamometer connected to an IXTA
Electrode Placement and EMG Setup Instructions
- Have the subject remove all jewelry from their wrists. For the initial exercises in this lab, EMG recordings and muscle force measurements will be taken from the subject’s dominant arm (the arm they use most frequently).
- Clean the electrode placement sites using an alcohol swab. Scrub three specific areas on the inside of the subject’s dominant forearm, then allow the skin to dry. The placement areas are as follows:
- Near the wrist
- Midway along the forearm
- Approximately 2 inches from the elbow (refer to Figure 2 for guidance).
- Peel off the plastic backing from a disposable electrode and firmly apply it to one of the cleaned areas. Repeat this process for the remaining two areas. Secure any excess electrode cables (brown and white) with tape to prevent movement.
- Remove the ROAM EMG from the docking station and properly connect the electrodes as shown in Figure 2. and place the electrodes as shown.
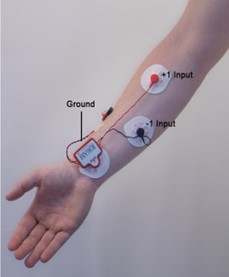
Figure 2: Placement of EMG electrodes on the forearm.
Start the Software
- Click on the Labscribe25 shortcut on the laptop to open the program.
- Close the two pop-up windows that appear.
- In the Main window, open the Settings menu and select Load Group.
- Navigate to the folder containing the settings group IPLMv7Complete.iwxgrp, select it, and click Open.
- If you don’t see this file listed, check the Complete Settings folders, it should be there.
- Open the Settings menu again and select Human Muscle – Wireless ROAM, then EMG-GripStrength-ROAM. (Figure 3)
- After a brief moment, LabScribe will load and display the EMG-GripStrength-ROAM configuration on the screen.
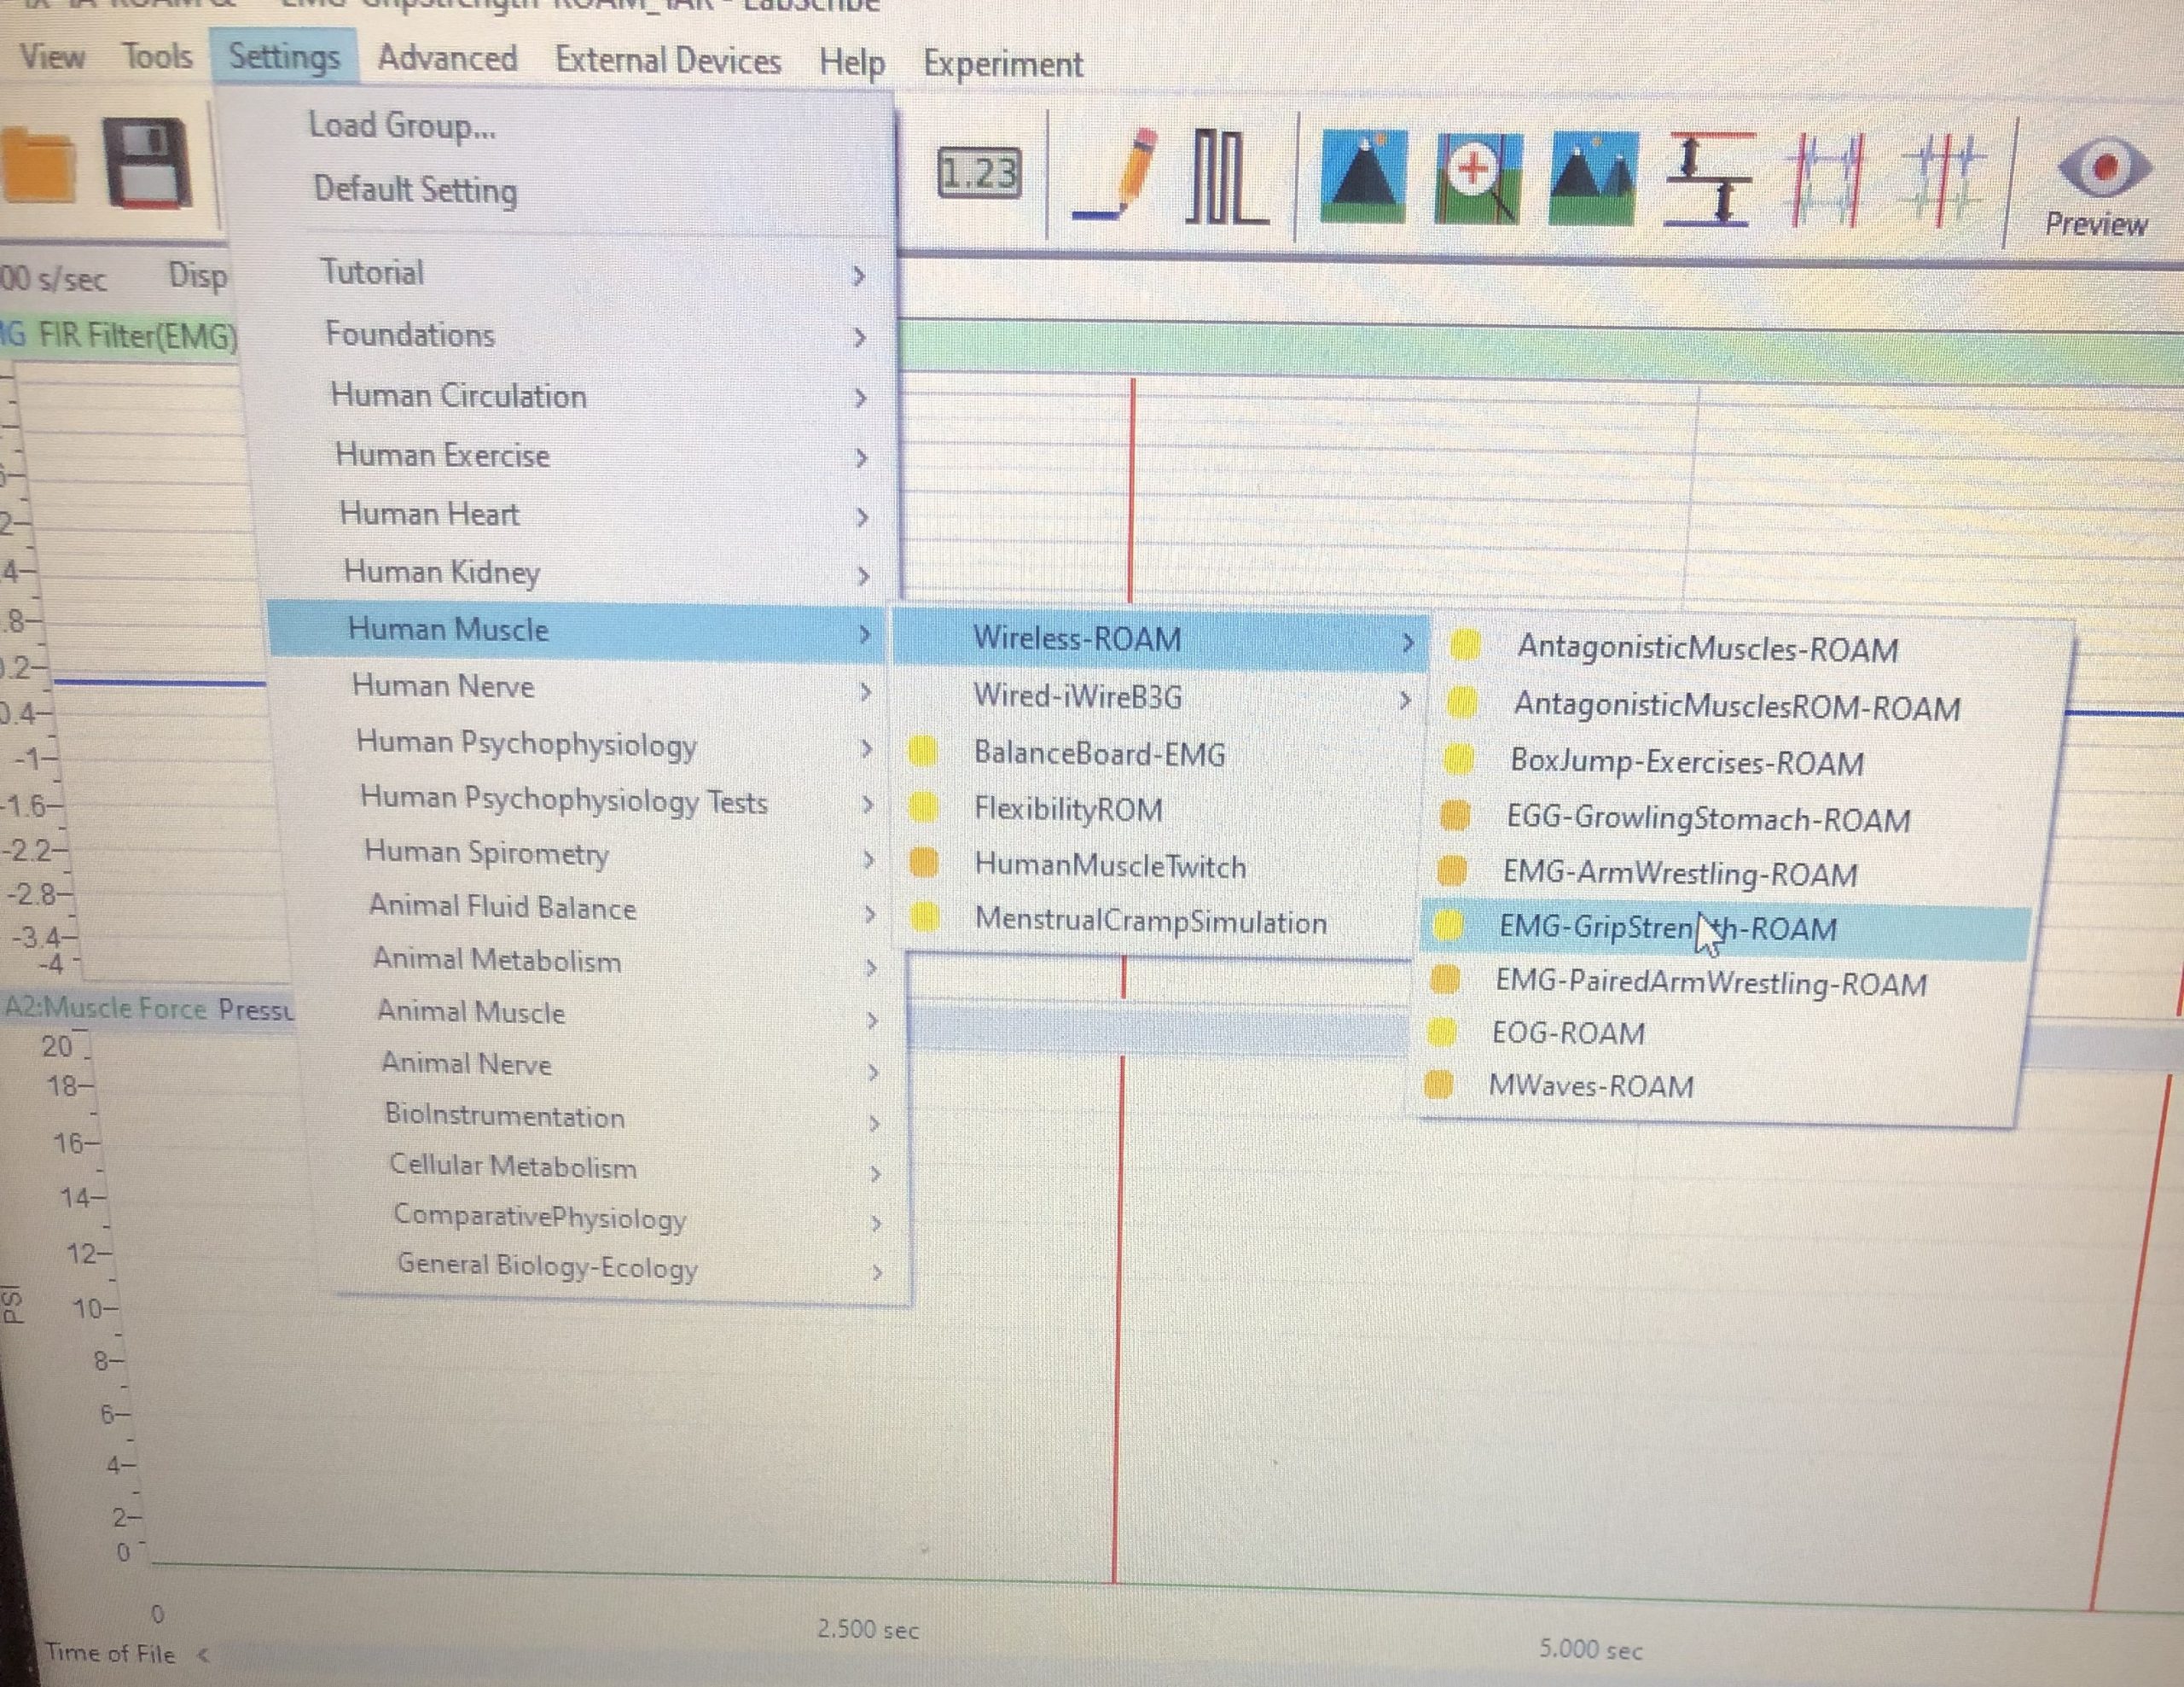
Figure 3: Lab selection (Human muscle – Wireless ROAM – EMG Grip-Strength ROAM).
Activity 1: EMG Intensity and Strength in Dominant Arm
Aim: to determine the relationship between intensity of EMG activity and the force of a muscle contraction in the subject’s dominant arm.
Approximate Time: 30 minutes
Procedure
- The subject should sit quietly with his or her dominant forearm resting on the table top. Explain the procedure to the subject.
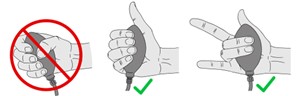
Figure 4. The correct position for holding the grip sensor.
- The subject will squeeze his or her fist around the hand dynamometer five times, each contraction is two seconds long followed by two seconds of relaxation.
- Each successive contraction should be approximately two, three, four times stronger than the first contraction; the final contraction should be full strength.
NOTE – If you max out the pressure and the signal flat lines – squeeze the bulb using ONLY your middle and ring fingers.
- Type Grip Force-Dominant in the Mark box. Click the Record button to begin the recording; then click the mark button to mark the beginning of the recording. After the recording is marked, tell the subject to begin squeezing the hand dynamometer following the procedure outlined in the step above.
- In the relaxation period after the last contraction, click the Stop button.
NOTE – If you max out the pressure and the signal flat lines – squeeze the bulb using ONLY your middle and ring fingers.
- Click the AutoScale buttons for the EMG and Muscle Force Channels. The recordings should be similar to the image below.
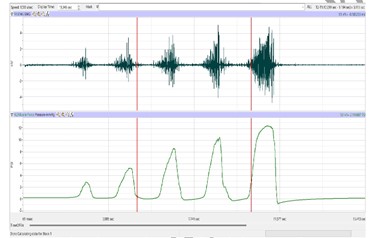
Figure 5: The EMG (upper) and muscle force (lower) for four progressively stronger contractions displayed in the Main window.
Data Analysis
- Use the Double Display Time icon to adjust the Display Time of the Main window, allowing you to view the five progressive muscle contractions. Click the icon that resembles two mountains to make this adjustment.
- Click on the Analysis window icon in the toolbar.

Figure 6: The LabScribe Toolbar.
- In the Analysis window, locate the Function Table above the uppermost table. This table should display the mathematical functions Abs. Int., V2-V1, and T2-T1. The corresponding values for each function appear in the table along the top margin of each channel.
- Once the cursors are correctly positioned to measure the absolute integrals under the muscle contraction and corresponding EMG activity, record the integral values in Table 1.
- Use the mouse to click on and drag the cursors to mark the beginning and end of the first muscle contraction (Figure 7). The Abs. Int. values in the EMG and Muscle channels represent the relative electrical activity causing the contraction and the relative muscle strength, respectively. Record these in Table 1.
- Repeat Steps 3-5 for the remaining four muscle contractions recorded in this exercise
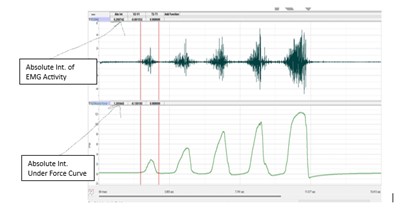
Figure 7: the EMG and muscle force recordings displayed in the Analysis window. The cursors are placed on the margins of the 2nd muscle contraction and the absolute integral function is used to measured the area under the EMG spikes and the area under the force recording.
7. Measure Forearm Circumference: Using the smart tape, measure the circumference of the dominant forearm at approximately 3 centimeters below the elbow. (Refer to the instructions on the next page for proper use of the tape). Record this measurement in table 1.
Table 1
| Dominant Forearm Circumference (mm): ______ | ||
|---|---|---|
| Relative Grip Strength | Absolute Int. of EMG Activity | Absolute Int. under Force Curve |
| Lowest | ||
| Higher 1 | ||
| Higher 2 | ||
| Higher 3 | ||
| Highest |
Think about these Questions:
- Do muscle fibers have a refractory period like nerve fibers?
- Does the amplitude of the EMG signal and the force of contraction, as measured by the absolute integrals, increase because a finite number of fibers are firing more often, or because more fibers are recruited to fire as the intensity of signals in the motor neurons increases, or a combination of these two?
Activity 2: EMG Intensity and Fatigue in Dominant Arm
Approximate Time: 15 minutes
Procedure
- The subject should sit quietly with his or her dominant forearm on the table top.
- Explain the experimental procedure of this exercise to the subject:
- The subject will squeeze the bulb of the hand dynamometer as tightly and as long as possible in an attempt to fatigue the muscles of the forearm.
- As time passes, the subject’s muscle force will decrease, but at a rate that is dependent on the fitness of the subject.
- When the subject’s muscle strength drops to a level that is below half of the subject’s maximum muscle force at the beginning of the recording, the recording will be stopped. This could take as little as 20 seconds or as long as a couple of minutes.
- Type Fatigue-Dominant in the Mark box. Click the Record button, followed by clicking the mark button. Record a baseline for ten seconds, then instruct the subject to squeeze and hold the hand dynamometer with as much force as possible. Continue to record.
- Click the AutoScale All button. The recording should be similar to the image below.
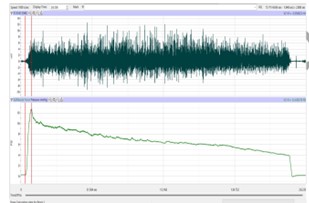 Figure 8: EMG and muscle force during muscle fatigue recording.
- When the subject’s muscle strength decreases to a level that is below 50% of the maximum muscle strength that was recorded at the beginning of this exercise, instruct the subject to release the bulb. NOTE: DO NOT stop until the recording is 50% of the starting squeeze strength.
- Click the Stop button to halt the recording.
Data Analysis
- Use the Display Time icons to adjust the Display Time of the Main window to show the complete muscle fatigue recording on the Main window.
- Data can be collected from the Main window or the Analysis window. If you choose to use the Analysis window, click on the Analysis window icon in the toolbar.
- The mathematical functions, V2-V1 and T2-T1 should appear on screen. Values for V2-V1 and T2-T1 on each channel are seen in the table across the top margin of each channel, or to the right of each graph.
- On the Muscle Force channel, use the mouse to click on and drag the cursors to specific points on the recording to measure the following (Figure 9):
- The maximum muscle force. To measure this force, place one cursor on the baseline before the muscle contraction and the second cursor on the peak muscle force near the beginning of the contraction. The value for V2-V1 on the Muscle Force channel is the amplitude.
- The half-max muscle force. Divide the maximum force by 2. Note this value.
- The half-max fatigue time, which is the time it takes the muscle force to decrease to 50% of the maximum during the fatigue experiment. Keep one cursor on the peak of the muscle force. Move the second cursor to the right of the peak muscle force until the absolute value for V2-V1, seen on the Muscle Force channel, is equal to the half-max muscle force.
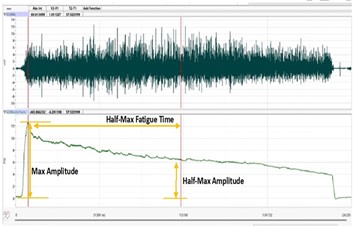
Figure 9: The EMG (upper) and muscle force (lower) during a prolonged muscle contraction displayed in the Analysis window. The cursors are placed on the muscle force channel to measure the half-max fatigue time.
Activity 3: EMG Intensity and Force in Non-Dominant Arm
Approximate Time: 15 minutes
Procedure
- Follow the same directions used in Exercise 1 to record data from the subject’s non-dominant forearm.
Data Analysis
- Analyze the data from the subject’s non dominant forearm as it was done in Exercise 1.
- Record the values for the parameters that were measured in Table 2.
- Use the smart tape to measure the circumference of the non-dominant forearm.
Table 2
| Non-Dominant Forearm Circumference (mm): ______ | ||
|---|---|---|
| Relative Grip Strength | Absolute Int. of EMG Activity | Absolute Int. under Force Curve |
| Lowest | ||
| Higher 1 | ||
| Higher 2 | ||
| Higher 3 | ||
| Highest |
Activity 4: EMG Intensity and Fatigue in Non-Dominant Arm
Approximate Time: 15 minutes
Procedure
- Follow the same directions used in Exercise 2 to record fatigue data from the subject’s non-dominant forearm.
Data Analysis
- Analyze the fatigue data from the subject’s non-dominant forearm as it was done in Exercise 2.
As you complete the exercises on EMG intensity and force using the hand dynamometer, consider the following to guide your understanding of the underlying muscle physiology:
1. Is one of the subject’s forearm stronger than the other?
2. Is there a difference in the maximum forces generated by the dominant and the non-dominant forearms?
3. Is there a relationship between the circumference of the forearm and the maximum force developed? Is there is, what is it?
4. If there a difference in the circumference of the forearms, is it caused by a difference in the number of muscle fibers in the forearms or the circumference of each muscle fiber in the forearm? Explain
5. How does the time to fatigue to half-strength in the dominant forearm compared to the same parameter for the non-dominant forearm?
6. Now, that you have answered the questions based on the exercises you performed, explain the physiology of the somatic nervous system. Be sure to describe the physiology of the somatic nervous system, also make sure to include a description of the chemical messenger involved in the somatic nervous system.
Activity 5: Muscle Fatigue (No iworx required)
Approximate Time: 10 minutes
Aim: Differentiate between isometric and isotonic contractions.
Procedure:
- Use the 3 lb. hand weight, start with your arm extended straight down and pick up the weight.
- Perform bicep curls as quickly as possible for 2 minutes, counting and recording the number of repetitions in Table 4.
- Repeat steps 1-2 two more times.
- Switch to your other arm and repeat steps 1-3.
TABLE 4
|
RIGHT HAND
|
LEFT HAND | |||
|---|---|---|---|---|
| NUMBER OF BICEP CURLS
|
NUMBER OF BICEP CURLS
|
|||
| SUBJECT 1 |
SUBJECT 1 |
|||
| SUBJECT 2 |
SUBJECT 2 |
|||
Think About These Questions
- Thinking back on what happened to your hand in Activity 4, is the following statement true or false?
The more fatigue you have in your arm muscles, the better your performance is in those arm muscles.
- The type of contraction used during Activity 4 when using the dumbbell or other activities such as sit-ups and pushups is __________________ (isometric/ isotonic) contraction.
- The type of contraction used during activities such as wall sit, plank, or trying to move an immovable object is ______________ (isometric/ isotonic) contraction.
- Our bodies rely heavily on energy pathways. These pathways involve many chemical reactions which will be affected by temperature. Therefore, if your body attempts to contract and relax muscle fibers in cold temperatures, that would _____________ (speed up/ slow) the process. Muscle contraction ________ (does/ does not) require energy. Muscle relaxation ____________ (does/ does not) require energy.
This Week’s focus for the POPS Project Includes:
- Abstract section with current data due at the end of lab.
IWorx Systems. 2024. Experiment HM-1: Grip Strength and Electromyogram (EMG) Activity
