8.1 PreLab Reading – ECG, Blood Pressure and Blood Characteristics
Overview
The heart functions as a muscular pump essential for circulating blood throughout the body. To efficiently propel blood, cardiac contractions must be precisely coordinated, regulated by the heart’s electrical conduction system. During each heartbeat, an electrical signal initiates from the heart’s upper chambers (atria) and propagates downward, stimulating contraction first in the atria and then in the ventricles. This rhythmic process repeats with every heartbeat. Any disease or damage to the heart can disrupt this electrical signaling, affecting the heart’s ability to contract properly.
The heart’s electrical activity can be evaluated using electrocardiography (ECG), which provides a graphical representation known as an electrocardiogram. This diagnostic tool is crucial for assessing cardiac function and identifying various abnormalities.
The cardiovascular system serves as the primary pathway for transporting materials across the body through the bulk flow of blood. Substances carried by the blood include oxygen, glucose, carbon dioxide, electrolytes, nutrients essential for cellular metabolism, hormones, and antibodies. Additionally, blood facilitates the distribution of body heat.
In this lab, we will explore the principles of ECG, measure blood pressure at rest and during exercise, determine hematocrit, and understand blood typing.
Electrical Conduction System in the Heart
We often think of the heart as a single muscular pump. The heart is two conjoined pumps working together to circulate blood throughout the body. The right side of the heart is responsible for pulmonary circulation, pumping blood to the lungs and then back to the left side of the heart. The left side of the heart handles systemic circulation, pumping blood throughout the rest of the body and then back to the right side. Both processes involve the sequential contractions of their respective atria and ventricles, synchronized by the heart’s electrical conjunction system.
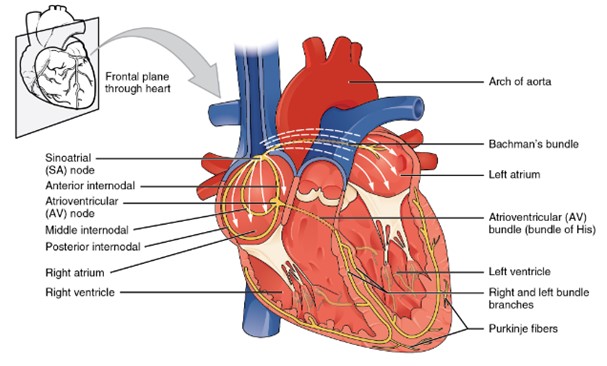
A diagram of the heart shows the major components of the cardiac conduction system. The sinoatrial (SA) node is located in the right atrium and initiates the electrical impulse. The impulse spreads across both atria to the atrioventricular (AV) node. From the AV node, the signal travels down the intraventricular septum through the bundle of His, then into the right and left bundle branches, and finally into the Purkinje fibers that spread throughout the ventricular walls. Arrows illustrate the direction of electrical flow from the atria to the ventricles. (Figure by CCCOER Pressbooks, used under a Creative Commons Attribution license.)
Cardiac myocytes (muscle cells) of the atria and ventricles form two distinct networks known as the atrial syncytium and the ventricular syncytium. Each syncytium consists of muscle cells connected by gap junctions, known as intercalated discs, which coordinate the contraction of the heart’s chambers. The electrical resistance through these gap junctions is very low, allowing for the free diffusion of ions. This facilitates the rapid propagation of action potentials (electrical impulses along the cell membrane) from one myocyte to the next. As a result, when one cardiac muscle cell contracts, all the cells in the syncytium contract together.
Normally, the heartbeat is driven by pacemaker cells in the sinoatrial (SA) node. Following each action potential, these pacemaker cells undergo slow, spontaneous depolarizations called pacemaker potentials. These potentials gradually depolarize the membrane to threshold, triggering the next action potential. The electrical impulses from the SA node are also transmitted through internodal pathways, which consist of specialized myocardial cells, to the atrioventricular (AV) node. Located in the right atrium near the opening of the coronary sinus, the AV node functions as a relay station, slowing the electrical current before it reaches the ventricles. This delay ensure that atrial contraction occurs before the ventricles are stimulated to contract.
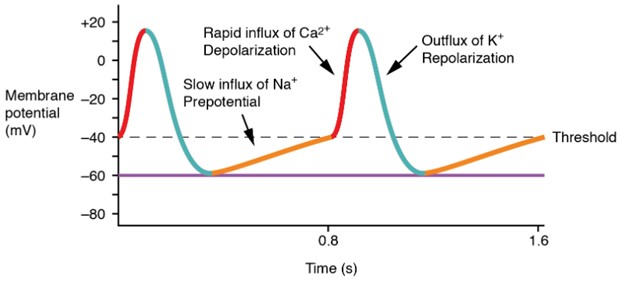
A graph illustrates the phases of a pacemaker cell action potential. The slow initial depolarization phase (shown in yellow) occurs due to the opening of sodium “funny” channels and transient calcium (Ca2+T) channels. This is followed by a rapid depolarization upstroke caused by L-type calcium (Ca2+L) channels. Repolarization occurs as potassium (K+) channels open, allowing K+ to leave the cell. The x-axis represents time, and the y-axis represents membrane potential, showing rhythmic, repeating action potentials characteristic of pacemaker activity. (Figure by CCCOER Pressbooks, used under a Creative Commons Attribution license.)
Once the electrical signals leaves the AV node, it travels down the interventricular septum through specialized fibers known as Atrioventricular (AV) bundle (previously known as bundle of His). From there, depolarization spreads to the apex of the heart and then upwards through the Purkinje fibers along the lateral walls of the ventricles. As the depolarization progresses through the ventricles, it triggers the contraction of the ventricular muscle tissue.
In most cardiac contractile cells, action potentials are characterized by a broad plateau phase, largely resulting from an increase in the cell membrane’s calcium permeability. The flow of calcium into the cells is crucial for triggering heart muscle contractions. The heart’s electrical activity can be recorded using electrodes on the skin surface, producing an electrocardiogram (ECG).
Cardiac Muscle Action Potentials
The depolarization phase begins when voltage-gated Na+ channels reach the threshold and open, allowing Na+ ions to flow into the cell and making the membrane potential more positive. This influx of Na+ ions also travel through gap junctions to neighboring cardiac muscle cells, creating a wave of depolarization occurs the atrial or ventricular myocytes.
Following depolarization, the voltage-gated Na+ channels close, initiating repolarization. However, shortly after repolarization begins, L-type voltage-gated Ca2+ channels open, leading to a plateau phase as Ca2+ enters the myocyte. The plateau phase is crucial as the incoming Ca2+ ions slow down the repolarization process, extending the refractory period. During the refractory period, the cell cannot respond to new stimuli and generate another action potential, allowing the cardiac muscle cells to fully contract, pump blood, and relax before the next contraction. This mechanism prevents summation of muscle twitches and tetanus, which would result in continuous contraction without relaxation, hindering the ventricles from refilling with blood.
At the plateau end, Ca2+ channels close, and additional voltage-gated K+ channels open, allowing K+ to exit the cell, causing rapid repolarization to the resting membrane potential. The resting phase follows repolarization, before the next depolarization occurs.
The SA node cells spontaneously depolarize, generating the next action potential, which in turn triggers another action potential in the cardiac muscle cells. This self-generated action potential process, known as auto rhythmicity, allows the heart to maintain its rhythm. Despite the intrinsic ability, the nervous and endocrine systems regulate the heart rate.
The conduction velocity of action potentials varies across different cardiac cells. The SA node and AV node conduct action potentials more slowly due to a limited presence of rapid voltage-gated Na+ channels. In these regions, conduction velocity is primarily controlled by Ca2+ channels. In contrast, atrial myocardial tissue has a faster conduction velocity and a shorter refractory period than the SA or AV nodes. Purkinje fibers and the ventricular myocardium exhibit even faster conduction velocities and a slightly longer refractory period compared to atrial myocardial tissue. These differences highlight the distinct physiological properties of the various types of cardiac cells.
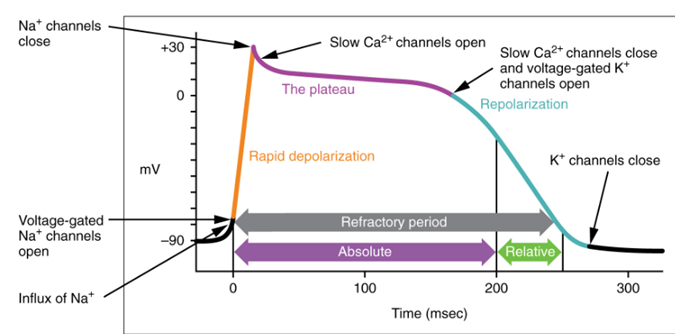
A graph shows the phases of a myocardial contractile cell action potential. The rapid depolarization phase is highlighted in yellow and is caused by sodium (Na+) influx. The plateau phase is marked in purple and results from a balance of potassium (K+) efflux and calcium (Ca2+) L-type channel influx. The repolarization phase is shown in blue and occurs as potassium (K+) leaves the cell. The x-axis represents time, and the y-axis represents membrane potential in millivolts. (Figure by CCCOER Pressbooks, under a Creative Commons Attribution license.)
Basic Electrocardiographic Principles and Concepts
Electrocardiography is the process of creating an electrocardiogram (ECG or EKG) using a device called an electrocardiograph. An ECG is a graphical representation of the heart’s electrical activity at a specific time. The electrical impulses that trigger heart muscle contractions travel through the body and be detected by electrodes attached to the skin. These electrodes, positioned on different sides of the heart, measure electrical activity form various angles and can be either positive or negative.
The ECG output reveals the overall rhythm of the heart and can detect problems in different parts of the heart muscle. It is widely regarded as the best method for identifying and diagnosing abnormal heart rhythms and, in some cases, pinpointing damaged areas of the heart muscle.
Deflection and the Isoelectric Line
As electrical waves propagate through the heart, differences in electrical potential arise between depolarized and polarized tissue. These changes in electrical activity are measured relative to the isoelectric line or baseline. The isoelectric line represents the resting phase between repolarization and the next depolarization when no electrical activity is occurring. These changes are recorded as a series of deflection, indicating the movement of electrical waves.
ECG Waves – A normal ECG for a complete cardiac cycle (heartbeat) consists of a set of deflections known as the P wave, the QRS complex, and the T wave. The isoelectric line (baseline) represents the interval between the end of one heartbeat and the start of the next.
|
P Wave |
Atrial depolarization as electrical activity moves from the SA node towards the AV node and spreads from the right atrium to the left atrium. This occurs just prior to atrial contraction. It lasts about 0.08 to 0.10 seconds.
|
|---|---|
|
QRS Complex |
This is composed of the Q, R, and S waves that occur together as a result of ventricular depolarization. In fact, each of these three waves actually represents a different stage of depolarization of the ventricles. On the ECG, the QRS complex appears larger than the P wave. One reason for this is that the ventricles contain more muscle mass than the atria. The QRS complex occurs prior to contraction of the ventricles. Normally, the duration of the QRS complex is 0.06 to 0.10 seconds. A duration that is greater than 1 second may be an indication of an impairment of electrical conduction through the ventricles.
|
|
T Wave |
Repolarization of the ventricles. In terms of the cardiac cycle, it indicates the relaxation of the ventricles after contraction.
|
**It should be noted that the ECG does not show a wave corresponding to atrial repolarization. This is because it occurs at the same time as ventricular depolarization and is completely hidden by the QRS complex.
Electrocardiographic Leads
In the context, the term “lead” refers to a combination of electrodes that form an imaginary line the body along which electrical signals are measured. For our purposes, the wires connecting the electrodes to the computer, which acts as our electrocardiograph, are considered connections, not leads.
Electrocardiographic leads are bipolar, meaning they consist of a negative and a positive terminal. This configuration enables them to detect changes in electric potential between these two points. Therefore, each lead represents graphically the electrical potential difference between its two terminals.
There are three standards leads:
| Lead I | This is between the right arm and left arm electrodes. The negative terminal is attached to the right arm, while the positive terminal is attached to the left arm. |
|---|---|
| Lead II | This is between the right arm and left leg electrodes. The negative terminal is attached to the right arm, while the positive terminal is attached to the left leg. |
| Lead III | This is between the left arm and left leg electrodes. |
ECG Intervals and Segments
An ECG represents two axes: the vertical axis depicts millivolt changes in electrical potential, while the horizontal axis indicates the period in seconds during which these events occur. Intervals typically begin with a complete ECG wave, whereas segments do not. Key ECG intervals and segments include:
- PQ or PR Interval: This interval spans from the beginning of the P wave to the beginning of the QRS complex. It measures the time from atrial depolarization onset to ventricular depolarization onset, reflecting the period from atrial systole to ventricular systole. It generally lasts from 0.12 to 0.20 seconds. Due to the absence of the Q wave in some cases, it is also referred to as the PR interval.
- QT Interval: This interval starts from the beginning of the QRS complex to the end of the T wave. It covers the period from the onset of ventricular depolarization to the end of ventricular repolarization or from the onset of ventricular systole to the end of ventricular diastole. The normal QT interval duration ranges from 0.30 to 0.44 seconds.
- RR Interval: This is the time between two consecutive R waves. The heart rate (in beats per minute) can be calculated form the ECG by dividing 60 by the RR interval.
- TQ Segment: This segment is measured from the end of the T wave to the beginning of the next Q wave. It represents the period from the end of ventricular repolarization to the beginning of ventricular depolarization, signifying ventricular diastole.
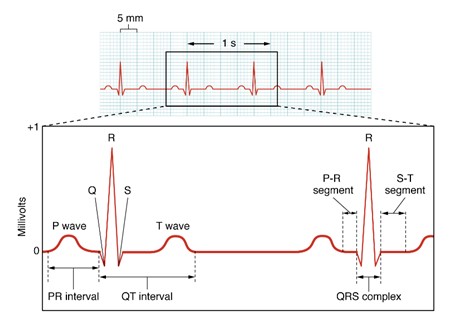
An electrocardiogram (ECG) tracing is shown with the typical wave pattern: a small P wave, a sharp QRS complex, and a rounded T wave. The tracing represents the heart’s electrical activity over time as detected by surface electrodes. (Figure by CCCOER Pressbooks, used under a Creative Commons Attribution license.)
A Diagnostic Tool
Electrocardiography (ECG) serves as a crucial tool for evaluating cardiac function and identifying potential issues. Below are specific examples demonstrating its diagnostic utility:
P wave: Changes in the shape and duration of P waves can indicate atrial enlargement.
PR interval: This interval signifies the time from atrial depolarization onset to ventricular depolarization onset. Prolongation of the PR interval (>0.2 seconds) may indicate a first-degree AV block, typically associated with AV node of His/Purkinje system dysfunction. Conversely, a very short PR interval can suggest conditions such as Wolff-Parkinson-White (WPW) syndrome, characterized by premature ventricular stimulation due to abnormal heart conduction.
QRS complex: Evaluation of the QRS complex aids in diagnosing various heart conditions, including arrhythmias, conduction abnormalities, ventricular hypertrophy, and myocardial infarction. An elongated QRS duration (> 0.12 seconds) may indicate Purkinje fiber dysfunction. Changes in QRS complex morphology, such as Q waves exceeding 1/3 the R wave height, may indicate myocardial infarction.
R wave split: A split R wave suggests asynchronous ventricular depolarization, often due to bundle branch damage or inadequate heart blood supply.
Blood Flow
Blood supplies the necessary nutrients and oxygen to the body’s cells and transports products produced by cells, such as hormones and metabolic waste, away from those cells. To ensure a continuous supply of blood to the cells, the cardiovascular system must regulate blood flow (measured in L/min) to the entire body and to each part of the body under a variety of conditions. The flow of blood through any part of the circulatory system is affected by two interrelated factors as demonstrated by the flow rule equation:
Flow (L/min) = ∆P (mm Hg) / Resistance (peripheral resistance units)
The pressure difference between two points (∆P) is simply the blood pressure at the beginning minus the blood pressure at the end of the region of interest. These pressures are recorded in units of mm Hg because if a mercury-filled tube, known as a manometer, is placed through the wall of a vessel, the pressure from the fluid in that vessel will cause the column of mercury to rise a certain number of millimeters. Blood pressure thus represents the force being placed upon the walls of the vessel by the blood within that vessel.
Resistance is the drag experienced by the molecules as they flow past the wall of the blood vessel. There is no easy way to measure resistance in a living system; however, it can be calculated (using the above equation) if one knows the flow rate and the pressure difference between the beginning and end of the system. Resistance to blood flow is affected primarily by (1) the diameter of the vessels, (2) the length of the vessels, and (3) the viscosity of the blood.
The blood flow pathway from the left ventricle to the right atrium supplies blood to all of the organs of the body and is called the systemic circuit. The pathway of blood flow from the right ventricle to the left atrium passes through the lungs and is known as the pulmonary circuit. The length of the systemic circuit is much greater than that of the pulmonary circuit; therefore, the resistance in the systemic circuit is much greater than that of the pulmonary circuit.
The volume of blood pumped by each ventricle of the heart per minute is called the cardiac output (CO), which is a measure of blood flow. The pressure difference between the left ventricle and the right atrium, the beginning and end of the systemic circuit, can be calculated as the mean arterial pressure (MAP) minus the central venous pressure (CVP). You will learn about how MAP is calculated later in this lab. For practical purposes, CVP is usually 0 mm Hg. Thus, the ∆P for the systemic circuit is MAP – 0 mm Hg, or MAP. The combined resistance of all blood vessels within the systemic circuit is referred to as total peripheral resistance (TPR). Thus, the original flow rule equation from above can be rewritten as:
CO = MAP / TPR
As mentioned above, adequate cardiac output must be maintained to supply all parts of the body properly. The heart is the main organ responsible for maintaining the cardiac output. The cardiac output can be changed by changing the heart rate (HR) and/or the stroke volume (SV). Stroke volume is the volume of blood pumped by a ventricle per contraction or beat and is measured in L/beat. The relationship among these variables is demonstrated by the following equation:
CO (L/min) = HR (beats/min) x SV (L/beat)
Blood Pressure
The contraction of the ventricular generates a pressure wave transmitted through the blood vessels. This wave’s peak pressure during ventricular contraction is termed systolic pressure. At rest, the typical systolic pressure is larger arteries of systemic circulation is 120 mm Hg. Following contraction, as ventricular muscle relax, pressure within these arteries decreases, known as diastolic pressure, typically around 80 mm Hg at rest. Blood pressure is expressed as systolic over diastolic pressure, normally 120/80 mm Hg under resting conditions. Consistently elevated diastolic pressure (above 90 to 100 mm Hg) indicates hypertension, increasing the risk of cardiovascular disease and heart attack. Diastolic pressure is sometimes referred to as the heart’s “afterload”.
Due to resistance differences between pulmonary and systemic circuits, systolic pressure from the right ventricle can be lower than from the left, regulated to maintain equal blood flow through both circuits.
Direct measurement involves inserting a catheter into an artery, monitoring pressures supporting a column of mercury (Hg) in a manometer. However, it’s invasive, risky, impractical clinically, and painful. Instead, the auscultatory technique is commonly used for indirect measurement. In this method, a cuff is placed around the upper arm near the elbow and inflated to approximately 160 mm Hg, temporarily occluding the brachial artery. As pressure is gradually released (about 5 mm/sec), blood flow begins to return when ventricular contraction generates a pressure greater than that in the cuff. This produces the first audible sounds, which indicate systolic pressure. These sounds, known as Korotkoff sounds, are not caused by the opening or closing of valves but rather by turbulent blood flow through the partially compressed artery. As the cuff pressure continues to decrease, the sounds initially grow louder, then gradually soften, and eventually disappear when blood flow becomes laminar, marking diastolic pressure.
Blood pressure readings are taken from the sphygmomanometer gauge attached to the cuff, which is calibrated against a mercury manometer. For accurate measurements, the stethoscope should be positioned at heart level, and proficiency in this technique requires practice.
Heart Rate
The normal resting heart rate is governed by a cluster of specialized cardiac muscle cells collectively known as the pacemaker, or sinoatrial (SA) node. These cells are capable of generating action potentials independently of external nerve or hormonal stimuli, make them auto rhythmic. The autonomic nervous system modulates this intrinsic heart rate. Normal parasympathetic control, mediated via the vagus nerve, slightly reduces the pacemaker’s rate of 90-120 beats per minute to around 70 contractions per minute at rest. Heart rate can be monitored using various methods: auscultation with a stethoscope placed over the chest, an electrocardiogram (EKG), or simply by feeling the pulse at an artery. The sounds heard through a stethoscope are produced by the rush of blood past closing heart valves.
The arterial pulse reflects the heart rate and can be assessed by palpating the radial or carotid artery, or by using external devices like a pulse plethysmograph on a fingertip. When assessing the pulse rate, particularly when the body is stationary in different positions (e.g., reclining or standing), its’ common practice to monitor it for fifteen seconds and then multiply that count by four to determine the beats per minute. During dynamic changes in heart rate, such as during exercise or when transitioning from rest to standing, the pulse rate is typically monitored for ten seconds and then multiplied by six to calculate the beats per minute.
Local Control of Blood Flow
Cardiac output is distributed among organs based on their metabolic needs. Local blood flow to organs or tissues is primarily regulated by altering the resistance of arterioles through vasoconstriction or vasodilation. Arteriolar resistance can be controlled extrinsically, via hormones or the autonomic nervous system, or intrinsically, through mechanisms like myogenic control, metabolic factor, or locally secreted chemical messengers.
Myogenic control aims to maintain constant organ blood flow despite variations in Mean Arterial Pressure (MAP), which typically increases during activities like exercise. Smooth muscle around arterioles responds to changes in blood pressure: when MAP is high, arterioles constrict to reduce blood flow; when MAP is low, arterioles dilate to increase blood flow. This mechanism is crucial for regulating blood flow to vital organs such as the brain and kidneys.
Local control of blood flow is also influenced by metabolic factors generated within tissues. Arteriolar smooth muscle is sensitive to these metabolic byproducts. For instance, in the systemic circuit, increased CO2 and H+ levels and decreased O2 levels prompt arteriolar dilation, enhancing blood flow to the area. Conversely, vasoconstriction occurs under opposite conditions.
Increased blood flow to a local area due to arteriolar dilation is termed hyperemia, which can be active or reactive. Active hyperemia refers to increased blood flow driven by heightened tissue metabolic activity, where tissues consume more O2 and produce CO2, prompting arteriolar dilation to meet metabolic demands. For example, skeletal and cardiac muscles experience active hyperemia during exercise, while the GI tract does so post-meal.
Reactive hyperemia involves increased blood flow following temporary ischemia, caused by functional vasoconstriction or physical vessel obstruction. High CO2 and low O2 levels induce arteriolar dilation to restore blood flow once the obstruction is relieved.
Regulation of Blood Pressure
Blood serves a crucial role in supplying nutrients and oxygen to cells while transporting metabolic waste and hormones away from them. The cardiovascular system maintains a continuous blood flow to the body and its organs under various conditions, regulated by two key factors described by the flow equation:
The pressure difference between two points is the difference in blood pressure from the start to the end of a specific region, measured in millimeters of mercury (mm Hg). This pressure reflects the force exerted by blood against the vessel walls, detectable by a mercury-filled manometer.
Resistance represents the frictional force experienced by blood molecules as they move along vessel walls. While resistance is challenging to measure directly in living systems, it can be calculated using the flow rate and pressure difference within the system. Blood flow resistance depends mainly on 1) vessel diameter, 2) vessel length, and 3) blood viscosity.
Blood flows from the left ventricle to the right atrium through the systemic circuit, supplying all organs in the body. Conversely, blood flows from the right ventricle to the left atrium via the pulmonary circuit, passing through the lungs. The systemic circuit is significantly longer than the pulmonary circuit, resulting in higher resistance in the systemic circulation.
Cardiac output (CO), the volume of blood pumped by each ventricle per minute, serves as a measure of overall blood flow efficiency.
Components of Blood
Blood is composed of cells – red blood cells (erythrocytes), white blood cells (leukocytes), and platelets – and plasma, the fluid component containing water and dissolved substances such as proteins, nutrients, ions, hormones, and waste products. It serves several vital functions, including the transport of nutrients, wastes, oxygen, carbon dioxide, and hormones. Blood also plays roles in defense through its white blood cells, supports clotting mechanisms, helps maintain pH balance, and contributes to thermoregulation.
Determination of Blood Hematocrit
Various test can be conducted on blood to evaluate a patient’s health. For instance, a complete blood count (CBC) assesses the quantity of each blood cell type, the hematocrit (Hct), hemoglobin levels, and mean corpuscular volume (MCV), among other parameters. The hematocrit measures the percentage of red blood cells (RBCs) in blood sample.
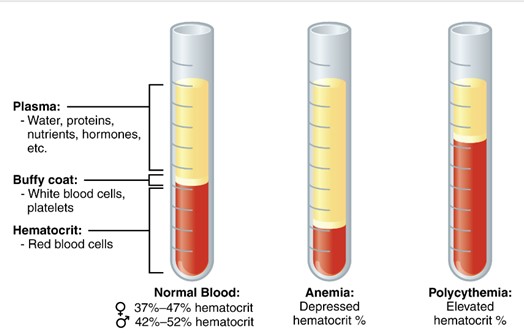
A test tube of centrifuged blood is shown separated into three layers. The bottom layer contains erythrocytes (red blood cells), the thin middle “buffy coat” contains leukocytes and platelets, and the top layer contains plasma. (Figure by CCCOER Pressbooks, used under a Creative Commons Attribution license.)
After centrifuging a blood plasma in a hematocrit tube, the hematocrit, or packed cell volume (PCV), is determined. For example, if the hematocrit of a sample is 46%, it means that out of the total blood volume in the tube (100%), 46% consist of RBCs, while the remaining 54% is plasma. Normal hematocrit values for adult males range from 41% to 50%, and for adult females, from 36% to 48% (these values may vary slightly between labs).
A hematocrit below the normal range indicates anemia, characterized by a lower concentration of RBCs and/or reduced hemoglobin. Conversely, a high hematocrit (polycythemia) indicates an elevated percentage of RBCs in the blood. Factors contributing to high hematocrit include dehydration (reduced plasma volume increases the percentage of RBCs in the tube) and living at high altitudes, where the body produces more RBCs due to lower oxygen levels in the air.
Anemia can result from various causes such as blood loss, kidney failure, iron deficiency, and immune-mediated hemolytic disorders. Symptoms of anemia include fatigue, shortness of breath, rapid heart rate, and pale gums. There are numerous types of anemia, with common forms including Iron Deficiency Anemia (IDA), Megaloblastic Anemia, and Pernicious Anemia.
Determining Blood Type
The two blood groups crucial in triggering blood transfusion reactions are the ABO blood group and the Rh blood group. Type A red blood cells (RBCs) bear the A antigen, a glycoprotein, on their surface; type B RBCs carry the B antigen; type AB RBCs present both A and B antigens; and type O RBCs lack both A and B antigens.
Interesting, individuals with type A blood naturally produce anti-B antibodies against the B antigen on type B RBCs (usually, antibodies are only formed after prior exposure to an antigen). Similarly, those with type B blood produce anti-A antibodies. Type O individuals have both anti-A and anti-B antibodies, while those with type AB blood have neither antibody.
Rh Factor
The presence of the Rh factor (D), a protein antigen, determines whether a person is Rh+. If the Rh factor is present on the surface of red blood cells (RBCs), the person is Rh+. Conversely if the Rh factor is absent, the person is Rh-. Individuals who are Rh- do not naturally produce antibodies against the Rh factor. However, if they receive a blood transfusion with Rh+ blood, they will develop antibodies against the Rh factor.
When identifying a person’s blood type, the positive or negative designation is added after the ABO blood group to indicate the presence or absence of the Rh factor. For instance, someone with type A positive (A+) blood has RBCs with both the A antigen and the Rh factor. On the other hand, someone with type A negative (A-) blood has RBCs with only the A antigen and lacks the Rh factor.
Blood Typing
Determining blood type involves identifying the presence or absence of specific antigens (A, B, and Rh factor) on the surface of red blood cells. When antibodies bind to these antigens, they cause the red blood cells to agglutinate, or clump together, which is visually detectable. If a particular antigen is absent on the red blood cells, the corresponding antibody will not cause agglutination.
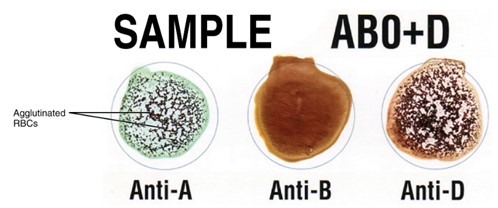
Illustration showing how agglutination occurs when incompatible blood types mix. Red blood cells with specific surface antigens clump together after reacting with corresponding antibodies, forming visible clusters. (Figure by CCCOER Pressbooks, used under a Creative Commons Attribution license.)
Clinicians can quickly determine a patient’s blood type using a blood typing card. The card has three circles representing anti-A antibodies, anti-B antibodies, and anti-D (Rh factor) antibodies. By observing agglutination reactions in these circles, the blood type can be identified. For instance, if agglutination occurs in the circle anti-A antibodies, it indicates the presence of the A antigen on the red blood cells. If there is no agglutination in the circle with anti-B antibodies, it means the B antigen is absent. Agglutination in the circle with anti-D antibodies signifies the presence of the Rh factor (Rh+).
This week in lab, you will have the opportunity to determine your own blood type. To prepare, please watch the following training video before coming to lab: This link directs you to a YouTube video demonstrating the proper steps and safety procedures for performing a blood-typing test.)
This video will guide you through:
- Correct fingerstick technique
- Proper cleaning and disinfecting procedures
If you prefer not to participate in this activity, you may opt out and complete an alternative blood typing exercise using synthetic blood.
Blood Transfusion and Transfusion Reactions
When a patient requires a blood transfusion, ideally, we aim to match their blood type precisely. However, under certain circumstances, different blood types can be used as long as the patient does not possess antibodies against the donated red blood cells (RBCs). For instance, individuals with type AB+ blood are universal recipients and can safely receive any blood type without risking a transfusion reaction. Conversely, type O- individuals are universal donors because their blood lacks A, B, and Rh antigens, making it compatible with any blood type.
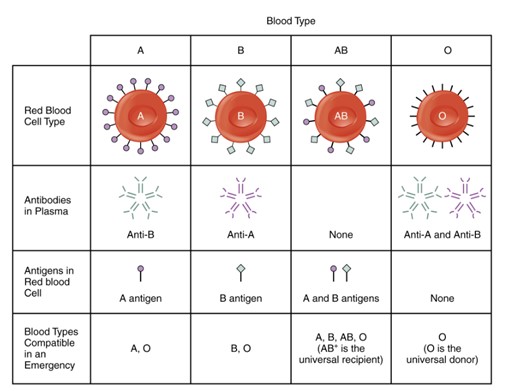
Diagram showing the four main human blood types and their surface antigens and antibodies. Type A blood has A antigens on red blood cells and anti-B antibodies in plasma. Type B has B antigens and anti-A antibodies. Type AB has both A and B antigens and no antibodies. Type O has no antigens and both anti-A and anti-B antibodies. (Figure by CCConline Pressbooks, used under a Creative Commons Attribution License.)
In an incompatible blood type is transfused, a transfusion reaction occurs. During this reaction, the patient’s antibodies bind to and clump the donated RBCs. These clumps can obstruct small blood vessels, leading to tissue damage and potentially fatal outcomes. Additionally, the immune system may hemolyze the agglutinated RBCs, releasing excess hemoglobin that can clog kidney nephrons, causing kidney failure and further complications. Symptoms of a transfusion reaction include fever, chills, shortness of breath, itching, hives, nausea, low blood pressure, and rapid heartbeat (tachycardia).
Adapted from Human Physiology Lab Manual by Jim Blevins, Melaney Farr, and Arleen Sawitzke, Salt Lake Community College.

