1.1 PreLab Reading – Homeostasis, Circadian Rhythm, and Data Collection
This introductory lab serves as the cornerstone for the entire semester, anchoring the course around the fundamental concept of homeostasis.
While this lab may not involve as much hands-on activity as subsequent ones, it lays the groundwork with extensive pre-lab reading. This reading is essential for familiarizing yourself with the concepts that will form the basis of class discussions. Moreover, internalizing the principles explained in this lab is vital of success in both this course and your broader physiological education.
Reminder: As part of your prelab preparation, you are encouraged to download this document Lab-1-Circadian-Worksheet and record your sleep data for at least 3 consecutive days leading up to this lab. Be sure to record the total of hours of sleep each night and note any disruptions. In the lab, you will use this data and work with your group to combine and analyze your sleep data.
Homeostasis
At the core of physiology lies the principle of homeostasis. It refers to the body’s remarkable ability to maintain balance, though not necessarily constant, during varying internal and external conditions. This balance is established and maintained through the regulation of regulated variables such as blood pressure, pH, glucose concentrations, and body temperature, which fluctuate around a set point within a defined set range. Notably, the body can adjust these set points and ranges in response to changing environmental factors. For instance, the set range for resting state differs significantly from that during physical exertion.
Negative Feedback
To maintain a regulated variable within its designated set range, the body uses negative feedback. When the variable drifts beyond its set range, these mechanisms promptly kick into action, working to counteract the deviation and steer the variable back toward its set point. Negative feedback mechanisms entail three key components:
- Sensors: Typically, neurons or receptors that communicate with neurons, these components monitor the variable’s status.
- Integrating Center: Usually housed within the central nervous system or the endocrine glands. This center evaluates the variable’s level in relation to the set range and determines the appropriate corrective response to uphold or restore homeostasis.
- Effectors: Tissues or Organs, usually muscles or glands, these elements execute the determined response, effectively bringing the variable back within its designated range.

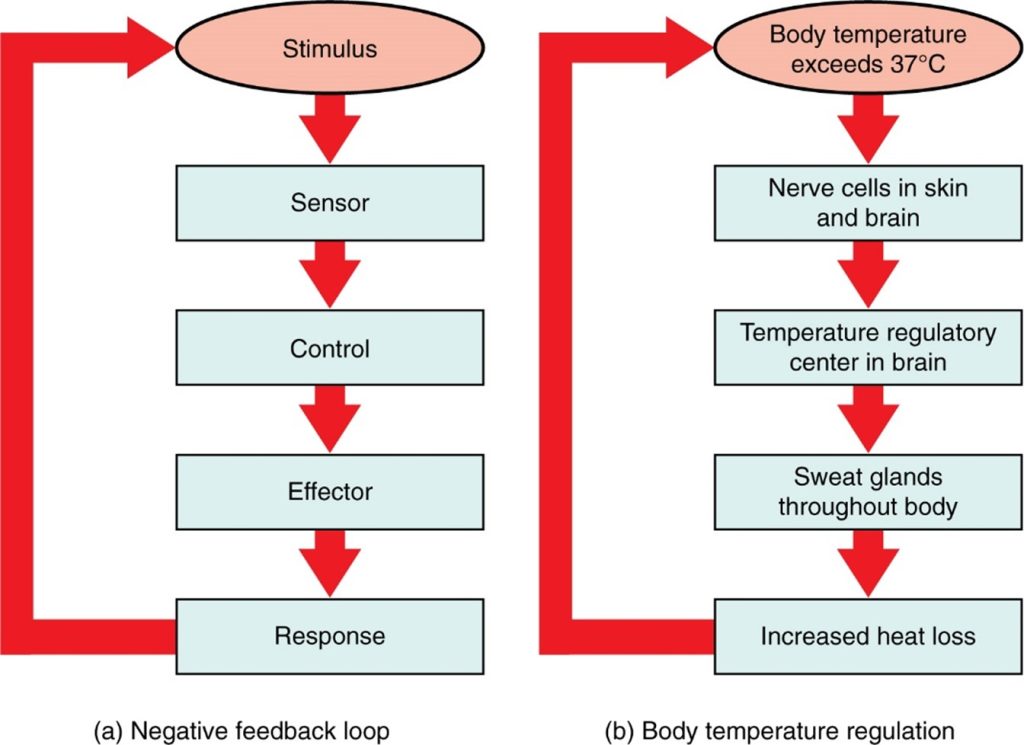
The image shows two diagrams illustrating a negative feedback system.
Left diagram: A loop with arrows demonstrates a negative feedback cycle. It shows a stimulus triggering a sensor, which sends information to a control center. The control center then sends signals to an effector. The effector causes a response that counteracts the original stimulus, reducing it and completing the loop.
Right diagram: A flowchart shows how the body temperature is regulated through negative feedback. It includes components such as a change in body temperature (rising), sensory receptors that detect the change, the brain acting as the control center, and effectors such as sweat glands that respond to restore normal temperature.
(Figure by OpenStax is used under a Creative Commons Attribution license.)
Feed Forward Mechanism
In addition to negative feedback, the body also employs feed-forward mechanisms to support the maintenance of homeostasis. These mechanisms enable the body to anticipate changes in variables and proactively prepare for them, minimizing the magnitude of the subsequent change.
One illustration of feed-forward mechanism is evident in the regulation of blood glucose concentration. Upon food digestion in the small intestine, the release of a hormone known as GIP (glucose-dependent insulinotropic peptide) prompts the pancreas to release insulin before the anticipated rise in blood glucose levels. Subsequently, as blood glucose levels rise post-absorption, a negative feedback mechanism comes into play; additional insulin secretion increases the initial release stimulated by GIP, and body cells (effectors) absorb and store glucose, thereby lowering blood glucose levels back to their set point. Together, these interplay of negative feedback and feed-forward mechanisms meticulously maintain blood glucose concentration within a narrow range.
Another instance of a feed-forward mechanism occurs when preparing for physical exertion, such as in anticipation of an athletic event like running a marathon. Prior to commencing the run, a marathon runner experiences an increase in heart rate, initiated by the release of epinephrine from the sympathetic nervous system. This anticipatory adjustment primes the body for the upcoming physical activity. The next time you gear up for exercise, take note of these feed-forward mechanisms. Do you observe your heart rate rising in anticipation?
Positive Feedback
Positive feedback mechanisms are engineered to amplify or intensify the response triggered by a stimulus. Unlike negative feedback and feed-forward mechanism, which aim to minimize deviations in the set range of a regulated variable, positive feedback mechanisms operate to push levels further away from “normal” ranges, effectively creating rapid change.
An example of positive feedback in the body is the intricate process of blood coagulation. When a blood vessel sustains damage, the initial contact triggers platelets to activate and adhere to one another. These activated platelets then release chemical signals, stimulating the activation of adjacent platelets, thus initiating a cascade effect where each step amplifies the preceding one. This amplification cascade, like a domino effect, ultimately lead to the formation of a platelet plug, sealing off the damaged area. Subsequently, activated platelets initiate another cascade by activating plasma enzymes, culminating in the production of thrombin and fibrin. Thrombin, in turn, prompts the production of more enzymes, perpetuating the positive feedback loop and ultimately forming a mesh of fibrin that entraps red blood cells, forming a blood clot. This clotting process serves to stop bleeding from the damaged vessel. However, unchecked activation of these mechanisms can result in undesirable and potentially harmful blood clotting, such as in the case of spontaneous blood clotting without blood vessel damage that may result in deep vein thromboses, pulmonary emboli, and even stroke.
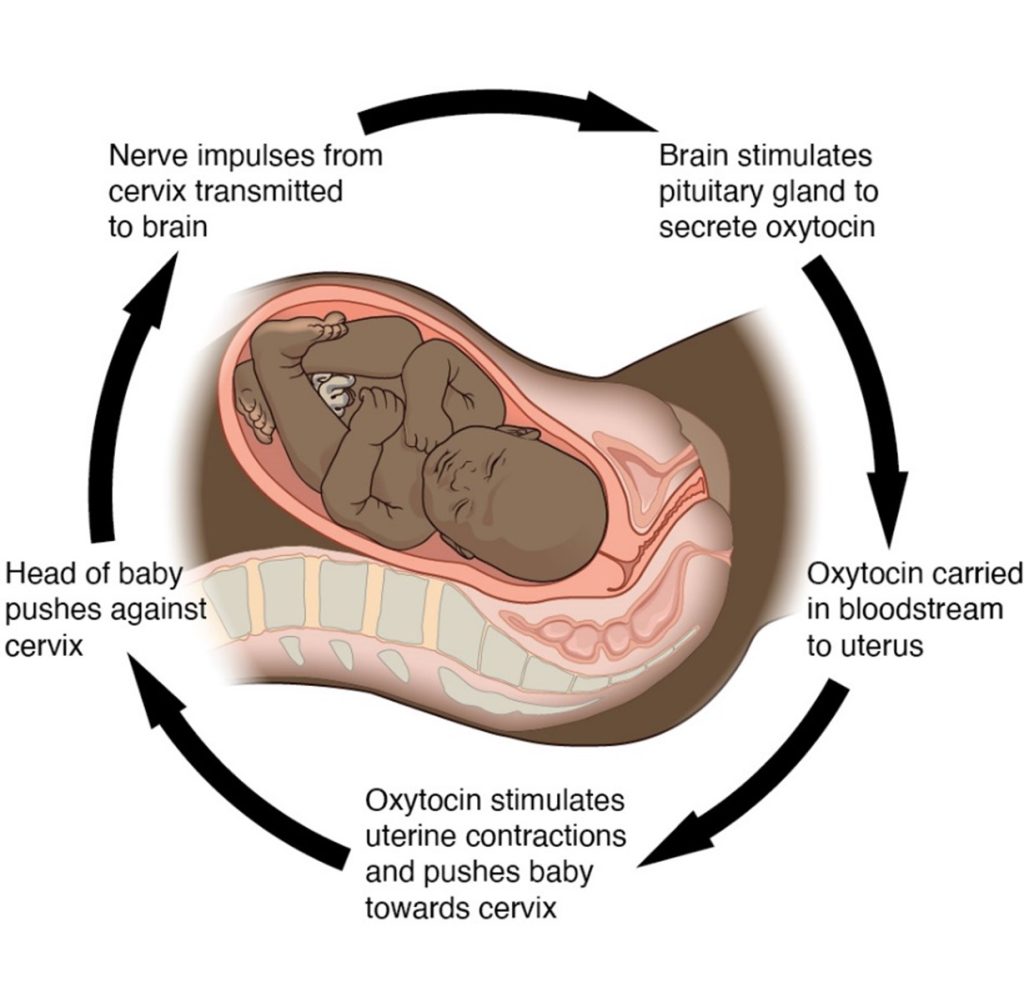
Another instance of positive feedback is observed during childbirth, where the posterior pituitary gland releases oxytocin. Oxytocin triggers contractions of the uterine smooth muscle, pushing the baby’s head against the cervix and exerting pressure. Sensors detect this pressure and relay the information to the hypothalamus, prompting further oxytocin release. This self-amplifying cycle continues until the baby is delivered through the cervix and the pressure that maintains the signal ends.

Positive feedback system using childbirth as the example. It shows a cycle in which a stimulus leads to a response that amplifies the original stimulus. Specifically, uterine contractions push the baby toward the cervix. Stretch receptors in the cervix detect this pressure and send signals to the brain. The brain responds by releasing more oxytocin, which increases the strength of the uterine contractions. This cycle continues with contractions intensifying and more oxytocin being release until childbirth is completed.
(Figure by OpenStax, used under a Creative Commons Attribution license.)
In both scenarios, the body’s existing state – whether blood clotting or baby in the uterus – is not to be maintained; rather, a change is required, and positive feedback mechanism ensure swift action. Once the triggering stimulus is resolved (e.g., the damaged vessel is repaired, or the baby is born), the effectors of the mechanism are deactivated. Overall, the response induced by a positive feedback system reinforces the original change that activated the system and persists until the stimulus is eliminated or another regulatory system intervenes.
However, positive feedback can also have detrimental effects. Circulatory shocks exemplify this, where insufficient blood flow to tissues due to low blood pressure can lead to life-threating positive feedback loops. Initially, the body attempts to counteract low blood pressure through negative feedback mechanisms. If these measure fail, decompensated shock develops, characterized by the escalation of positive feedback loops. For instance, reduced blood flow to the heart may lead to the death of cardiac muscle cells, further compromising the heart’s pumping function. As cardiac efficiency diminishes, blood pressure continues to fall, worsening tissue perfusion shortages and enabling a brutal cycle of deteriorating cardiovascular function. Therefore, positive feedback loops are only observed in mechanisms that need a rapid change in to maintain overall homeostasis.
Graphing
Scientists gather data to explore physical phenomena, and one of the most effective ways to organize this data is through graphical representation. Graphs serve to summarize and visually communicate patterns within the data, with the best graphs offering clear insights immediately. While various types of graphs exist, our focus will be line graphs and scatter plots, which you’ll be working with in the upcoming labs.
Before diving into graph creation, its’ essential to thoroughly consider the collected data. What variables were measured, and which ones remained constant? The independent variable, controlled by the scientist, is plotted on the x-axis (horizontal), while the dependent variable – the one under investigation – is plotted on the y-axis (vertical). A well-constructed graph provides a visual representation of the relationship between these variables. For example, if examining the effects of a new drug on heart rate, subjects may receive different doses of the drug (independent variable), while changes in the heart rate are recorded (dependent variable).
Next, determine the data range to effectively distribute it across the graphing area. Choose suitable unit intervals for easy plotting and always include appropriate labels (with units) for each axis. Additionally, provide a descriptive title for the graph, along with a figure number and descriptor to explain the plotted data.
Once the data is plotted accurately, analyze the graph for relationship between the variables. A positive correlation exists if the dependent variable increases with the independent variable, while a negative correlation occurs if the dependent variable increases as the independent variable decreases. Patterns may exhibit periodic variation, such as a sine wave, or display linear or exponential changes. Some relationships may reach a saturation point, while others might be affected by additional variables that disrupt or alter the observed pattern. These observations are crucial for understanding the phenomenon being studied through the experiment represented by the graph.
Circadian Rhythm
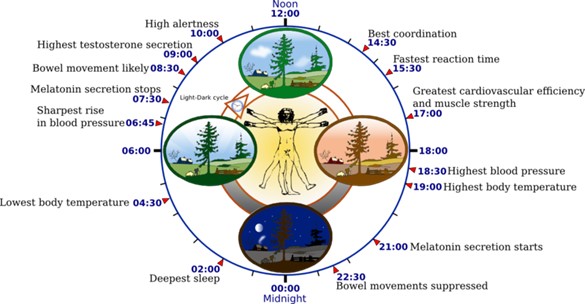
Now that we have discussed the basics of homeostasis and how graphs can and are used to display data, let us deepen our understanding of both by exploring regulated variables that fluctuate with light/dark cycles. Circadian rhythms encompass the self-sustaining, regular changes in both mental and physical characteristics that unfold over a 24–25-hour day (the term “circadian” derives from Latin, meaning “around a day”). Across a broad spectrum of cellular, physiological, and psychological processes, humans exhibit circadian rhythms. Researchers have pinpointed these rhythmic patterns in variables such as heart rate, blood pressure, respiration, and endocrine activity. Remarkably, these physiological rhythms often mirror corresponding psychological and behavioral processes, encompassing sensory, emotional, cognitive, and motor functions. The figure below illustrates some of the variables that undergo changes throughout the course of a 24-hour day.

The image illustrates circadian rhythms, showing how daily cycles of light and darkness influence biological processes. A 24-hour clock is typically used to represent changes across the day. The light portion of the cycle corresponds to wakefulness, increase alertness, and higher body temperature. The dark portion corresponds to sleepiness, melatonin release, and lowered body temperature. The diagram highlights that circadian rhythms regulate more than sleep and wakefulness, they also affect hormone levels, metabolism, and other physiological functions.
(Figure by OpenStax, used under a Creative Commons Attribution license.)
The hypothalamus plays a crucial role in coordinating circadian rhythms by integrating external cues regarding light levels and day length. Remarkably, even in the absence of external cues like alternating light and dark periods, these rhythms persist. Within the hypothalamus, the suprachiasmatic nucleus (SCN) emerges as the epicenter for establishing circadian rhythms.
Another crucial player in this intricate system is the pineal gland, situated within the brain, which secretes the hormone melatonin. Recent studies indicate that melatonin plays a fundamental role not only in regulating circadian rhythms but also in orchestrating seasonal variations. Melatonin levels surge in the evening, inducing drowsiness, and decrease during the day.
Questions
-
- What term describes the body’s ability to keep measurable variables within a healthy range?
- When elevated blood pressure is detected in the arteries, the body responds by slowing the heart rate. What mechanism is at work in this scenario?
- What term describes when your body anticipates an event or change before it occurs?
- What term describes a mechanism that is designed to amplify or enhance the response generated by a stimulus?
- In an experiment where time is used as one of the variables, it is considered the [dependent/ independent] variable and is always plotted on the [x/ y] axis. What is the correct designation for time in this context, and on which axis is plotted?
Adapted from Human Physiology Lab Manual by Jim Blevins, Melaney Farr, and Arleen Sawitzke, Salt Lake Community College.
