
25 Lab Protocol: Cellular Respiration and Photosynthesis
Analyzing the effect of activators and inhibitors on yeast fermentation
Baker’s yeast can use fermentation to produce ATP, ethanol, and CO2 from glucose. The CO2 produced in this process causes the dough to rise before baking bread. In today’s lab, we will test the effect of various molecules on the rate of CO2 production using respirometers to measure gas production. After mixing the reactants in the respirometer, the respirometer is inverted to completely fill the gas measuring tube with liquid. The respirometers are then placed into a 37-degree Celsius incubator to increase the rate of CO2 production. As the reaction proceeds, the CO2 produced will displace the liquid in the gas measuring tube allowing the scientist to measure gas production in mL.
Lab Safety
- This lab involves the use of toxic chemicals. Magnesium sulfate (MgSO4), Sodium Flouride (NaF), and phenolphthalin are all toxic and should be treated with care.
- Gloves must be worn while handling these chemicals and they must be disposed of properly.
- Please work with your instructor to dispose of these chemicals in the properly labeled waste beakers.
Designing experiments to test effects of substrate on CO2 production during glycolysis
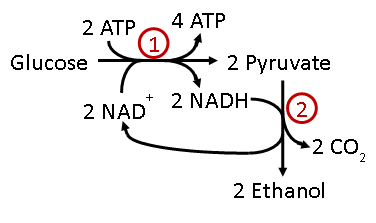
According to Figure 1 above, both glucose and pyruvate act as reactants in glycolysis and ethanol fermenation. The goal of this first experimental set up is to test the requirements for the reactions to occur.
Which ingredients must be present for the reaction to occur and for CO2 to be produced? Formulate a hypothesis to answer this question.
To test your hypothesis, each student group will design experiments to test the effect of the adding either pyruvate or glucose to a test tube and measuring CO2 production by enzymes provided in Baker’s Yeast. Two groups will partner together. One group will receive glucose and yeast. The other group will receive pyruvate and yeast.
Table 1: Group A will set up control and experimental tubes with the following labels and ingredients:
|
Tube Label |
glucose |
yeast |
water |
Total volume in respirometer |
Volume of CO2 produced
|
|---|---|---|---|---|---|
|
1 |
3 mL |
|
12 mL |
15 mL |
|
|
2 |
|
3 mL |
12 mL |
15mL |
|
|
3 |
3 mL |
3 mL |
___ mL |
15 mL |
|
Table 2: Group B will set up control and experimental tubes with the following labels and ingredients:
|
Tube Label |
pyruvate |
yeast |
water |
Total volume in respirometer |
Volume of CO2 produced
|
|---|---|---|---|---|---|
|
1 |
3 mL |
|
12 mL |
15 mL |
|
| 2 |
|
3 mL |
12 mL |
15 mL |
|
| 3 |
3 mL |
3 mL |
___ mL |
15 mL |
|
Testing the effects of an activator and inhibitor on glycolysis and ethanol fermentation
Before placing the control and experimental tubes in the incubator, you and your group will set up two more experimental tubes to test the effect of a known activator and a known inhibitor. Magnesium sulfate (MgSO4) is a cofoctor in the enzymatic reactions of glycolysis and the Krebs (Citric Acid) Cycle. It is a known activator. Sodium Flouride (NaF) is a known inhibitor of the enzyme enolase, which functions in the Citric Acid (Krebs) Cycle.
Again, each group will label and set up test tubes to test the effects on their given substrate: glucose or pyruvate.
Table 3: Group A will set up and label two test tubes according to the table below:
|
Tube Label |
glucose |
yeast |
water |
MgSO4 |
NaF |
Total volume in respirometer |
Volume of CO2 produced |
|---|---|---|---|---|---|---|---|
| 4 |
3 mL |
3mL |
___mL |
3mL |
|
15 mL |
|
|
5 |
3mL |
3mL |
___mL |
|
3mL |
15 mL |
|
Table 4: Group B will set up and label two test tubes according to the table below:
|
Tube Label |
pyruvate |
yeast |
water |
MgSO4 |
NaF |
Total volume in respirometer |
Volume of CO2 produced |
|---|---|---|---|---|---|---|---|
| 4 |
3 mL |
3mL |
___mL |
3mL |
|
15 mL |
|
|
5 |
3mL |
3mL |
___mL |
|
3mL |
15 mL |
|
Running the reaction in the incubator
Once your 5 respirometers are set up and labeled correctly, you will place them in the incubator at 37 C. Before you place your tubes in the incubator ensure that you follow the steps below.
- Ensure the column of the respirometer is full of liquid. This may require you to carefully tip the respirometer to allow air to travel down the column.
- Ensure they are labeled properly with tabe according to the tables above. Make sure your group has labeled your tubes properly to distinguish from other groups.
- Set a timer: you will stop the experiment once enough gas has been produced in at least one of your tubes. A good stopping point would be when one of your tubes has produced 4 mL of gas – this will prevent any overflow into the incubator. You may check on your tubes at 10 minute intervals and communicate with your instructor for guidance.
Analyzing Experimental Results
Once your experiment is complete, gather your results and discuss the following questions with your group. Groups A and B should exchange experimental results. You must answer these questions on your Student Data Sheet.
- How long did you incubate the respirometers at 37 C before assessing the CO2 produced?
- What was the purpose of adding yeast to the respirometer?
- What is the purpose of adding water to each tube?
- Which is the control tube when testing the effect of NaF?
- Which is the control tube when testing the effect of MgSO4?
- Write down conclusions about ethanol fermentation and the effect of MgSO4 and NaF.
Measuring CO2 Production in Fish by Aerobic Respiration
Aerobic respiration breaks down glucose to release 6 CO2 molecules. This CO2 can react with water to produce carbonic acid (H2CO3) which in turn can release bicarbonate (HCO3–) and hydrogen (H+) ions. Thus, the numerical decrease in pH of the fish water will correlate with the amount of CO2 produced and the rate of aerobic respiration.
Each group will test for the amount of CO2 produced by a fish in a beaker presumably performing aerobic repiration. You will use phenolphthalein as a pH indicator. It is colorless in acidic solutions and turns pink at or above a pH of 8. You will also use sodium hydroxide (NaOH), a base that will raise the pH of the water in the fish’s environment. The lower the pH of the fish water solution, the more NaOH will be necessary to increase the pH to the point where phenolphthalein turns pink. It is important to note that phenolphthalein is very toxic to fish. Hence all glassware must be washed thoroughly to ensure the fish stays healthy and alive. Furthermore, fish do not do well in chlorinated tap water; hence, be sure to use Aqua Safe-treated water in this experiment.
- Thoroughly clean glassware with Alconox glass cleaner before use and rinse thoroughly before beginning.
- Prepare two beakers: One control beaker with 100 mL Aqua Safe-treated water and one experimental beaker with 100 mL Aqua Safe-treated water.
- Use a net to capture a fish from the aquarium and gently place it into the experimental beaker. Cover the beakers with a petri dish. Start the timer for 30 minutes.
- After the incubation time is complete, remove the fish and place it back into the aquarium.
- Next, you will treat each beaker with 4 drops phenolphthalein. Observe if there is any color change.
- Add 1 drop 2.5 mM NaOH to each beaker, mix well, and look for a color change to pink.
- Repeat step 6 as many times as needed counting the number of drops until the water stays pink after mixing. Record the amount of NaOH added in data table.
Table 5: Recording data NaOH color change
|
Beaker |
Drops of NaOH added before color change |
|---|---|
|
Control beaker |
|
|
Experimental beaker |
|
Respond to the following in your Student Data Sheet:
- What is the purpose of phenolphthalein in this experiment?
- Why did you count the drops of NaOH you added to each beaker?
- Explain the results you obtained in this experiment:
Design a hypothetical experiment to test other variables:
If you had an opportunity to continue testing the effect of variables on CO2 production in respiring fish, how would you do it? Consider the following variables. Pick one variable and discuss with your group how you woudl run the experiment.
- The effect of water temperature.
- The effect of the type of organism: fish versus snail.
- The effect of the length of incubation time.
You will not carry out this experiment. However, you must outline the steps in your experiment in your Student Data Sheet.
Observe photosynthetic electron transport in leaves
The light reactions of photosynthesis include electron transport chains to pump hydrogen ions across the thylakoid membrane and to produce NADPH. The dye 2,6-dichlorophenol-indolephenol (DCPIP) can be used to measure the rate of electron transport. DCPIP, in its oxidized state, is blue. After accepting electrons, it becomes colorless. When designing experiments measuring electron transport, it is important to maintain a constant pH since the rate of electron flow is pH dependent.
Table 6: Each group will label and assemble the following reaction tubes:
|
Tube |
Plant extract |
0.1 M PO4 buffer pH 6.5 |
water |
0.2 mM DCPIP |
Light* |
Color at 0 minutes |
Color after 15 minutes light |
|---|---|---|---|---|---|---|---|
|
1 |
1 mL |
3 mL |
2 mL |
0 mL |
light |
|
|
|
2 |
0 mL |
3 mL |
2 mL |
1 mL |
light |
|
|
|
3 |
1 mL |
3 mL |
1 mL |
1 mL |
light |
|
|
|
4 |
1 mL |
3 mL |
1 mL |
1 mL |
dark |
|
|
Running the experiment:
- Once your tubes are set up, record the color of the contents of each tube before light treatment.
- Take a photograph of the 4 tubes.
- To run an experiment in the dark, you will cover Tube 4 with tin foil to test for the effect of light on electron transport. Place tubes in rack equidistant from light source (~ 1 – 2 feet away, do not want tubes to get too hot). from light source to reduce the effect of high temperature.
- Set the timer for 15 minutes. Record the color of the contents of each tube after light treatment. You may want to adjust the time depending on the rate of color change.
- Take a photograph of the 4 tubes.
- Compare the results of tubes 3 and 4 to make a conclusion of the effect of light on the rate of electron transport.
