
1 Background: Introduction to Micropipettes
The Process of Science
Biology is a science, but what exactly is science? What does the study of biology share with other scientific disciplines? Science (from the Latin scientia, meaning “knowledge”) can be defined as knowledge about the natural world.
The scientific method is a method of research with defined steps that include experiments and careful observation. The steps of the scientific method will be examined in detail later, but one of the most important aspects of this method is the testing of hypotheses. A hypothesis is a suggested explanation for an event, which can be tested. Hypotheses, or tentative explanations, are generally produced within the context of a scientific theory. A generally accepted scientific theory is thoroughly tested and confirmed explanation for a set of observations or phenomena. Scientific theory is the foundation of scientific knowledge.
A hypothesis must be testable to ensure that it is valid. For example, a hypothesis that depends on what a bear thinks is not testable, because it can never be known what a bear thinks. It should also be falsifiable, meaning that it can be disproven by experimental results. An example of an unfalsifiable hypothesis is “God is an omnipotent being.” There is no experiment that might show this statement to be false. To test a hypothesis, a researcher will conduct one or more experiments designed to eliminate one or more of the hypotheses.
Each experiment will have one or more variables and one or more controls. A variable is any part of the experiment that can vary or change during the experiment. A control is a part of the experiment that does not change.
Learning how to use micropipettes
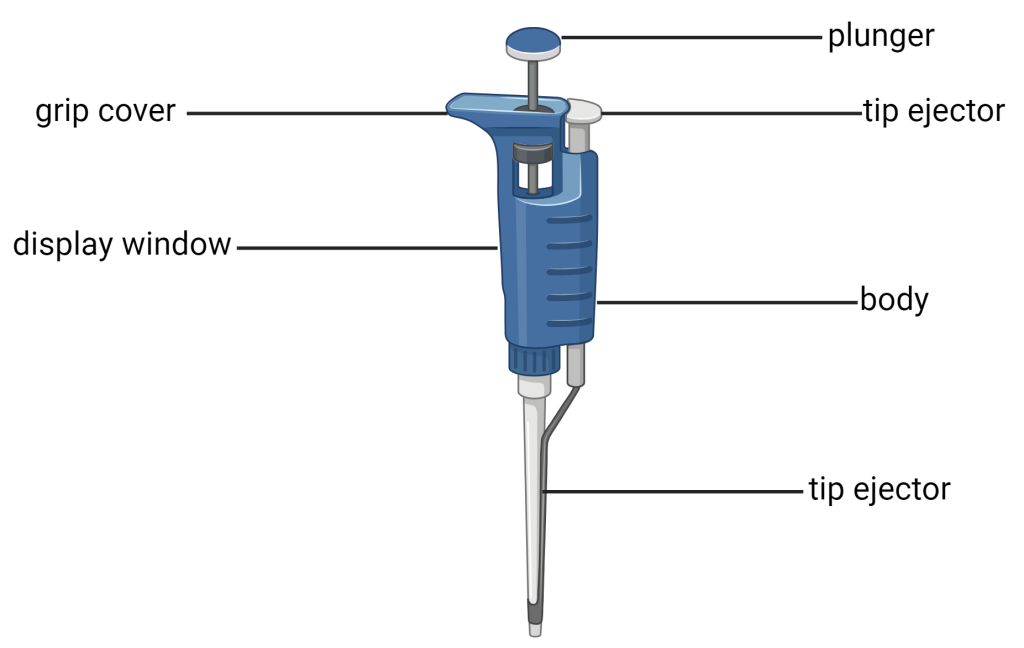
Micropipettes are used to transfer small volumes of liquids, typically less than 1mL. They have been used for over 60 years in many fields of science including molecular biology, genetics, microbiology, and chemistry. As a budding scientist, it is important for you to learn and master the art of micropipetting. The scales on micropipettes are in microliters (1000 µl = 1 ml). The three most commonly used sizes are p20, p200, and p1000. The size of the micropipette can be identified by the number on the round button on the plunger. The value is the maximum volume in microliters that can be transferred with that size pipette. They are used in conjunction with disposable sterile plastic tips.
Using a microipette involves measuring small volumes. The two most common volumes are the milliliter (mL) and the microliter (µl). Some common values for conversions between liters, milliliters, and microliters are found in the table below.
|
1 L |
1000 mL |
103 mL |
|
1 µl |
1000 µ l |
103 µl |
|
1 µl |
0.001 mL |
10-3 mL |
|
1 µl |
0.000001 L |
10 –6 L |
Measurements
Volume is the measure of the amount of space occupied by an object. The standard SI unit of volume is defined by the base unit of length (Figure 1.25). The standard volume is a cubic meter (m3), a cube with an edge length of exactly one meter. To dispense a cubic meter of water, we could build a cubic box with edge lengths of exactly one meter. This box would hold a cubic meter of water or any other substance.
A more commonly used unit of volume is derived from the decimeter (0.1 m, or 10 cm). A cube with edge lengths of exactly one decimeter contains a volume of one cubic decimeter (dm3). A liter (L) is the more common name for the cubic decimeter. One liter is about 1.06 quarts.
A cubic centimeter (cm3) is the volume of a cube with an edge length of exactly one centimeter. The abbreviation cc (for cubic centimeter) is often used by health professionals. A cubic centimeter is equivalent to a milliliter (mL) and is 1/1000 of a liter.
Density
We use the mass and volume of a substance to determine its density. Thus, the units of density are defined by the base units of mass and length.
The density of a substance is the ratio of the mass of a sample of the substance to its volume. The SI unit for density is the kilogram per cubic meter (kg/m3). For many situations, however, this is an inconvenient unit, and we often use grams per cubic centimeter (g/cm3) for the densities of solids and liquids, and grams per liter (g/L) for gases. Although there are exceptions, most liquids and solids have densities that range from about 0.7 g/cm3 (the density of gasoline) to 19 g/cm3 (the density of gold). The density of air is about 1.2 g/L. Table 1.4 shows the densities of some common substances.
While there are many ways to determine the density of an object, perhaps the most straightforward method involves separately finding the mass and volume of the object, and then dividing the mass of the sample by its volume. In the following example, the object’s mass is measured using a scale, but its volume is calculated geometrically from length measurements.
tubes and stuff
