
22 Backgroud: Genetics
Relationship between expected and observed frequencies
Scientists formulate hypotheses as potential explanations of what they have already observed and to predict what might happen in the future. One simply cannot state what is expected to happen without proposing an explanation by which that expectation can be met. Observations are always limited (in quantity, in detail) because data collection requires time and resources. The role of a scientist is complicated because observed numbers rarely match exactly what is expected according to the correct explanation.
The greater the quantity of observed data, the less of a role that chance is expected to play; hence, large data sets help scientists to differentiate between alternative hypotheses. For this reason, larger data sets are preferred when making experimental conclusions. Interestingly, Gregor Mendel counted over 7000 F2 pea seeds to conclude that ¾ have the dominant phenotype (round) and ¼ have the recessive phenotype (wrinkled).
Gregor Mendel’s experimental strategy
Gregor Mendel recognized that not all purple-flowered individuals are the same. He therefore crossed two true-breeding parents having different phenotypes for the same characteristic. In this way, all gametes produced by a particular parent would be the same, and all F1 offspring of the pair would have the same genotype. He discovered that all F1 offspring looked like one of the two parents indicating that one phenotype is dominant over the other (recessive). When these F1 individuals self-crossed, approximately ¾ of the offspring (F2 generation) exhibited the same phenotype as F1 individuals (dominant phenotype), and ¼ of the offspring exhibited the same phenotype as the true-breeding recessive parent. These experiments led Mendel to conclude that heterozygous parents (for example, genotype Aa) will produce two different gamete types at equal frequency (½ A and ½ a). This is known as the law of random segregation.
Mendel also performed dihybrid crosses using the same strategy described above (Figure 1). When performing dihybrid crosses, one must keep track of two different genes and two different alleles for each of those genes. It is important to use the same letter of the alphabet to represent both alleles of the same gene, and a different letter to represent both alleles of the other gene. Thus, YyRr represents the genotype of a double heterozygous individual, and YYrr represents an individual that is homozygous for the dominant allele of gene Y and homozygous for the recessive allele of gene R. Mendel concluded from his dihybrid cross experiments that two different genes will assort independently during gamete production. Thus, a YyRr individual is expected to produce 4 different gamete types (YR, Yr, yR, and yr) at equal frequency (¼ of each).
Some genes are located on sex chromosomes which are chromosomes with a different copy number in females versus males. In humans, the sex chromosomes are named X and Y. Females have two copies of the X chromosome (XX), and males have one copy of each (XY).

Two different alleles do not always have a dominant/recessive relationship
The relationship between two alleles of the same gene can be of three different types:
- One allele is completely dominant over the other. In this case, heterozygous individuals will have the dominant phenotype. Example: Pp pea plants produce purple flowers just like PP individuals.
- Both alleles act in a dominant fashion such that heterozygous individuals possess both phenotypes. Example: IAIB individuals have both blood type A and blood type B; this is known as blood type AB.
- Both alleles influence phenotype equally such that the phenotype of a heterozygote is intermediate between the phenotypes of the homozygous parents. Example: CRCR individuals have red flowers, CWCW individuals have white flowers and CRCW individuals have pink flowers.
Some genes have multiple alleles in a population
Many different alleles are possible for a given gene. This is because a gene often encompasses more than 1000 base pairs of genetic information. No position in a DNA molecule is exempt from mutation. For some human genes, dozens of different alleles have been identified. One well-known example of a gene with three recognized alleles is a gene that determines human blood type. In addition to the codominant IA and IB alleles, the recessive allele i has also been recognized. It is important to note that a diploid individual will only carry two copies of a gene even if multiple alleles exist in the population. With three different alleles, an individual can have one of six different genotypes: IAIA, IAIB, IBIB, IAi, IBi, and ii.
Pedigree Charts are used to determine the inheritance mechanism of a trait
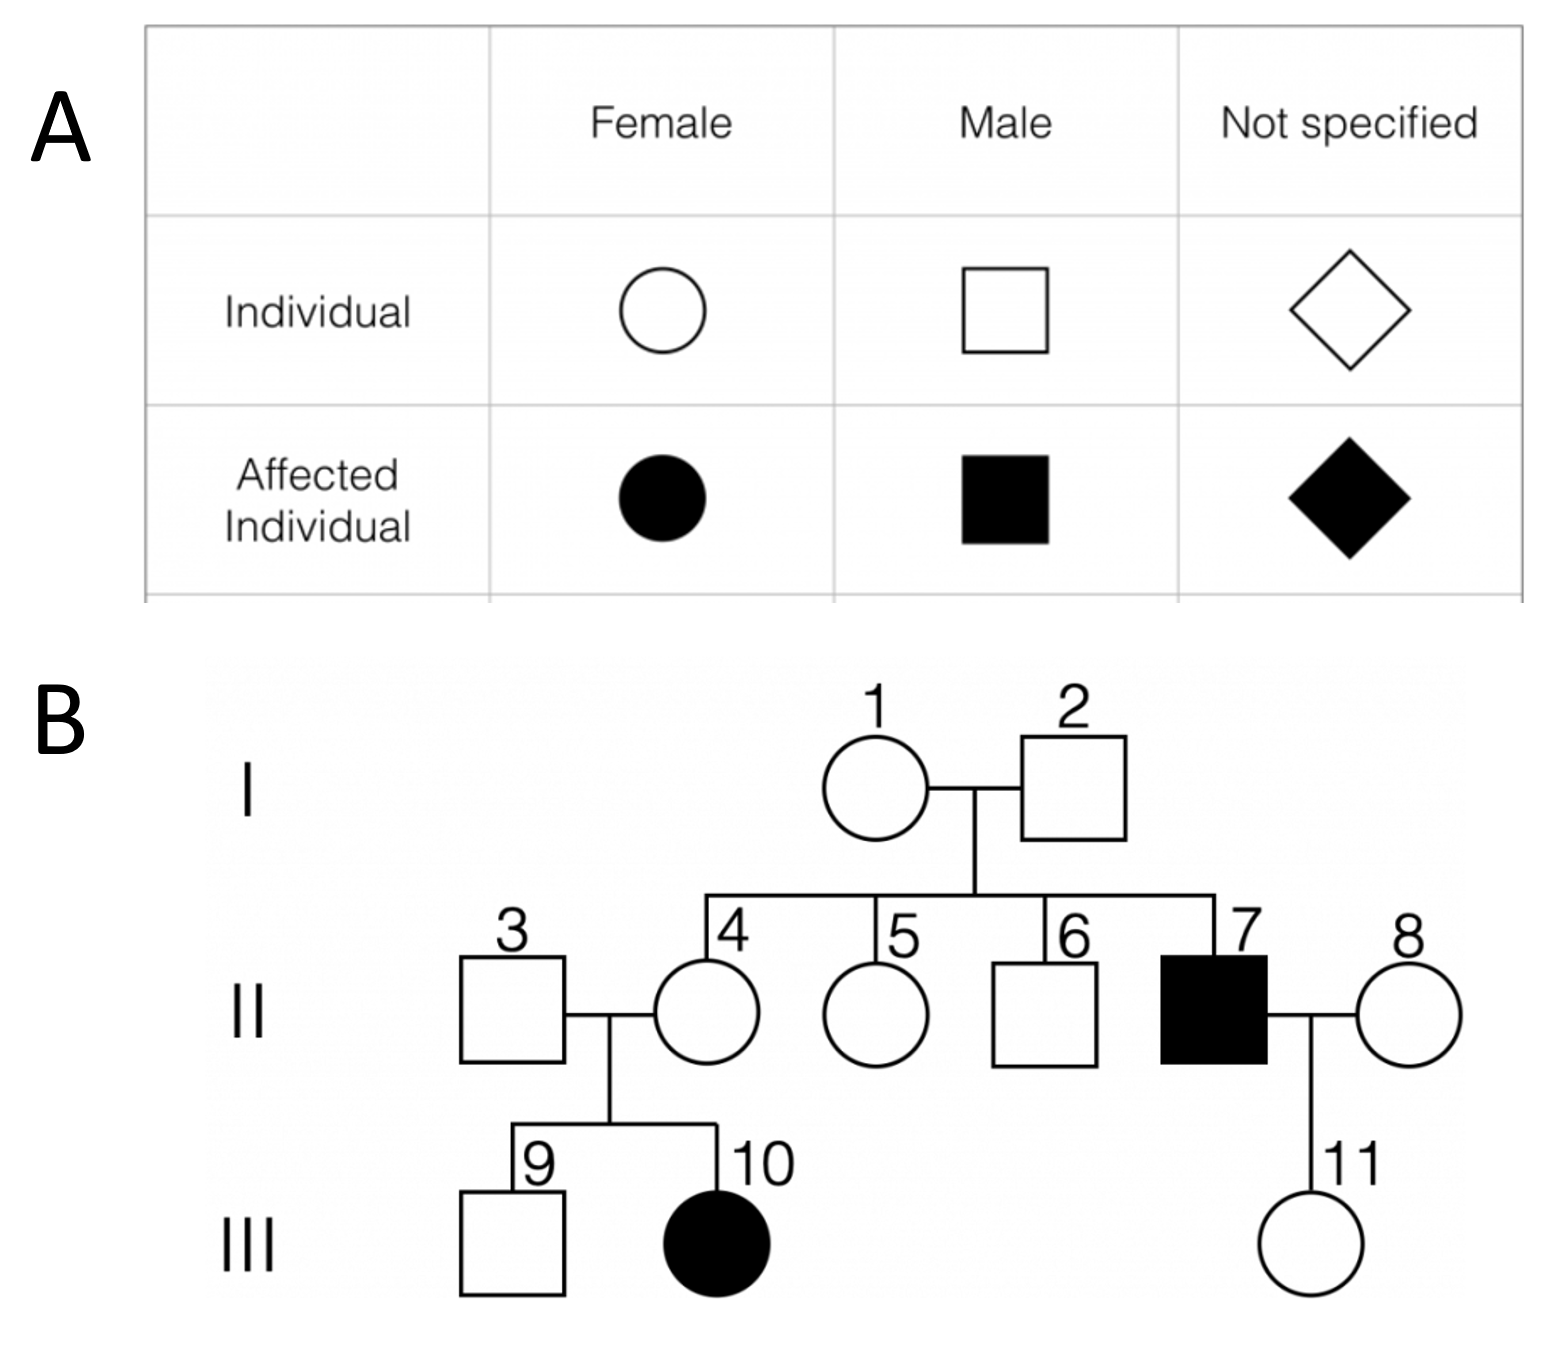
Charts and diagrams are often used to help visualize, organize, and understand data. Pedigree charts help scientists follow the inheritance of a particular trait over the course of many generations (Figure 2). On a pedigree chart, circles represent females and squares represent males. The symbol is filled in if the individual is affected by the mutant phenotype and not filled in if the individual has the normal phenotype. The symbols of a mating couple are linked directly by a horizontal line, and siblings are connected indirectly via vertical lines connected to the same horizontal line.
Some general features can help to differentiate between different inheritance mechanisms.
- Autosomal traits are determined by a gene located on an autosome (non-sex chromosome). They are expected to occur at equal frequency in female and male individuals.
- Sex-linked traits are determined by genes located on a sex chromosome (X or Y chromosome). Individuals of one sex or the other are expected to be affected more often.
- Dominant traits are those in which the mutant allele is dominant over the normal allele. Therefore, at least one parent of every affected individual is expected to be affected.
- Recessive traits are those in which the mutant allele is recessive to the normal allele. Therefore, it is possible and perhaps even likely that both parents of an affected individual are unaffected.
Here is a good strategy to identify the genotypes of individuals on a pedigree chart:
- Write a legend that explains the symbols you will use. An example for an X-linked recessive trait is: XA = X chromosome with normal allele, Xa = X chromosome with mutant allele, Y = Y chromosome that does not carry a copy of the relevant gene.
- Write down everything you know about the genotype of everyone on the chart without looking at parents and children. For a healthy female, the genotype could be either XAXA or XAXa; therefore, write down XA. Nothing written down during this step can be changed in step 3 without questioning the validity of the inheritance mechanism being tested.
- Now look at relationships (parents and children) of each individual to complete the genotypes and to verify that the inheritance mechanism is consistent with the pedigree information. Even after looking at all available information, the second allele an individual carries may remain unknown.
Identifying Blood Type
Identifying the blood type of a blood donor is important to determine possible recipients. This is because humans produce antibodies against antigens to fight diseases such as bacterial or viral infections. Individuals produce antibodies against “new” substances because they are recognized as foreign. Therefore, a person with blood type B can receive type B or type O blood but will reject type A or type AB blood – see table below.
| Blood type | A | B | AB | O |
| Antigen(s) produced | A | B | A and B | none |
| Can donate to | A, AB | B, AB | AB | O, A, B, AB |
| Can receive from | A, O | B, O | A, B, AB, O | O |
To determine someone’s blood type, antibodies against specific antigens are used. For example, an anti-A antibody will react with the A antigen and hence with blood from a type A individual. Rh+ is differentiated from Rh- blood using anti-D antibodies. Those with Rh+ blood will react to these antibodies causing the blood to coagulate. The D antigen is expressed from a different gene than the A or B antigens (gene I).
