16 Background: PTC Gene Analysis
Introduction to the PTC genotyping Lab
Genomes, chromosomes, genes, alleles, and SNPs
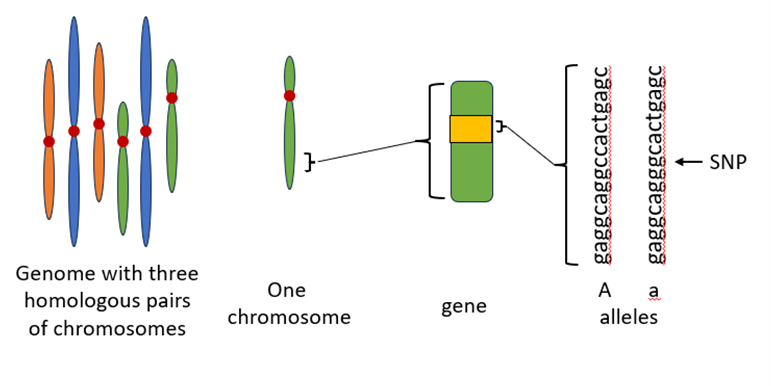
Genetic information helps to determine the phenotypes (visible characteristics) of individuals. It is important for us to understand the terms used in describing genetic information. Figure 1 shows a visual diagram of these terms. An organism’s genome consists of all DNA molecules in a cell of that organism. A eukaryotic cell typically contains multiple chromosomes, each of which includes one or two double-stranded DNA molecules. For example, human diploid cells typically contain 46 chromosomes, and haploid cells contain 23 chromosomes. A segment of a chromosome used in producing an RNA molecule is called a gene. Each eukaryotic chromosome includes the information to make many different proteins. The human genome includes approximately 20,000 – 25,000 protein coding genes; thus, there are around 1000 protein encoding genes per human chromosome.
An allele is a nucleotide sequence variant of a gene. Variation within the sequence of a specific gene can come in different forms such as deletions, insertions, and point mutations or base substitutions. The change in the DNA might (or might not) cause a significant or noticeable effect on the phenotype of the individual. Some changes, such as large deletions or insertions within a gene, will significantly alter the protein. This will almost certainly alter the function of the protein and cause changes to phenotype. However, even small changes such as single nucleotide deletions, insertions, and base substitutions might cause noticeable changes to phenotype. For example, the loss of a single nucleotide within the coding region of a gene is known as frameshift mutation since every codon beyond that point will be changed. Thus, all amino acids added beyond the deletion site will be different than before the mutation occurred. Even a single nucleotide substitution that causes a single amino acid change (missense mutation) or that results in a premature stop codon (nonsense mutation) may affect the function of the encoded protein. Single nucleotide polymorphisms (SNPs) refer to genetic differences between individuals that involve a base substitution at a single position (for example, the change from an A-T base pair to a G-C base pair).

Figure 1: Size comparison between genome, chromosome, gene, allele, and SNP.
Parts of a gene
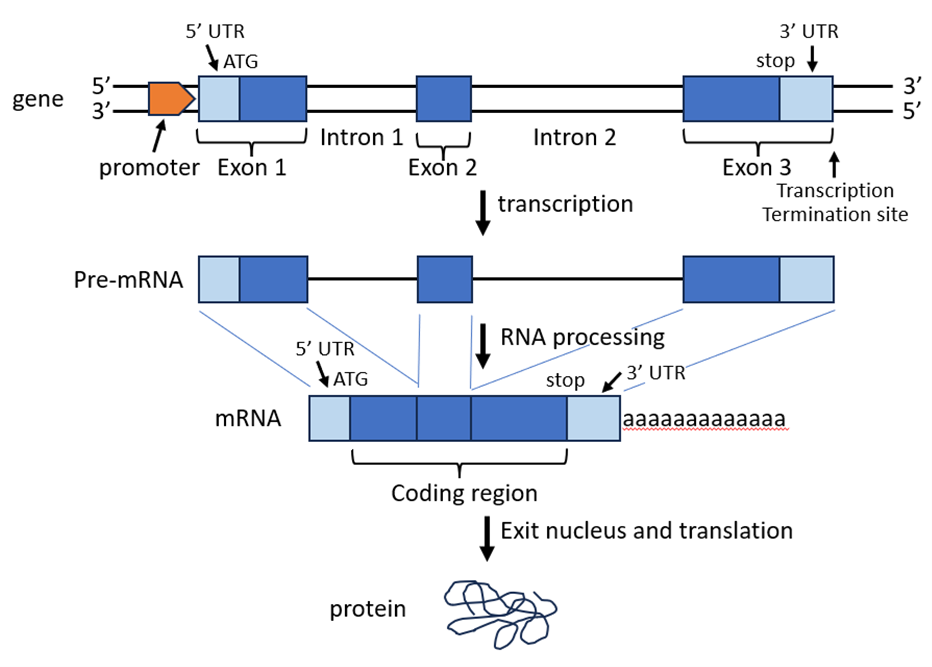
A gene is composed of multiple important parts. Figure 2 depicts the sequential steps of gene expression for a generic gene in which the parts are named and mapped. The promoter serves as the initial binding site for RNA polymerase during transcription initiation. Transcription proceeds as the RNA polymerase moves forward until it reaches the transcription termination site. Exons are the regions that will be retained in the mRNA whereas introns will be removed during RNA processing. A 5’ cap and 3’ polyA tail are also added during the processing event. The coding region begins at the AUG start codon and ends at the stop codon. The 5’ end of the mRNA in front of the start codon is called the 5’ untranslated region (5’ UTR) and the 3’ end beyond the stop codon is called the 3’ UTR. After RNA processing, the mature mRNA enters the cytoplasm where ribosomes are located such that translation can take place to produce a functional protein.

Figure 2: Diagram of the sequential events of gene expression taking place in a eukaryotic cell.
The PTC gene and two allelic variants
One goal of this lab is to reinforce the hypothesis that genotype often correlates with phenotype. In the PCR lab, we isolated DNA from our cheek cells and PCR-amplified a short segment of a particular gene known as the PTC gene. In this lab, we will analyze these PCR products to determine each person’s genotype (genetic make-up) at this specific location in the genome. We will also identify each person’s phenotype (observable trait) by tasting a non-toxic, bitter compound called phenylthiocarbamide (PTC). Some will be able to taste the chemical (taster phenotype) and others will not (non-taster phenotype). Note: an individual’s phenotype for this characteristic is not expected to affect their fitness or health. We will then compare each person’s genotype to their phenotype to determine if they correlate.
The PTC gene encodes a G protein-coupled receptor (GPCR) that functions as a taste receptor for naturally occurring bitter compounds. Like all GPCRs, the PTC protein includes 7 alpha helices that span the cell membrane with an extracellular amino terminus and an intracellular carboxyl terminus. Several SNPs have been identified in the coding region of this gene. The SNP we will analyze in this lab is known to correlate with the ability or inability to taste PTC. The taster allele is known to be dominant (T) over the ‘non-taster’ allele (t). Since two different alleles have been recognized, three different genotypes are possible in the human population. They are TT (homozygous taster), Tt (heterozygous taster), and tt (homozygous non-taster).
To differentiate between the T and t alleles, the restriction enzyme HaeIII is used to digest the PCR products (Figure 3). Restriction enzymes are enzymes that cut both strands of double-stranded DNA molecules at locations called recognition sequences. Each restriction enzyme has its own recognition sequence. The recognition sequence for HaeIII is 5’ GGCC 3’. Note that the length of both PCR products is 221 base pairs (bp). HaeIII will cut the PCR products representing the T allele (generates a 44 bp and a 177 bp fragment) but not the products representing the t allele.

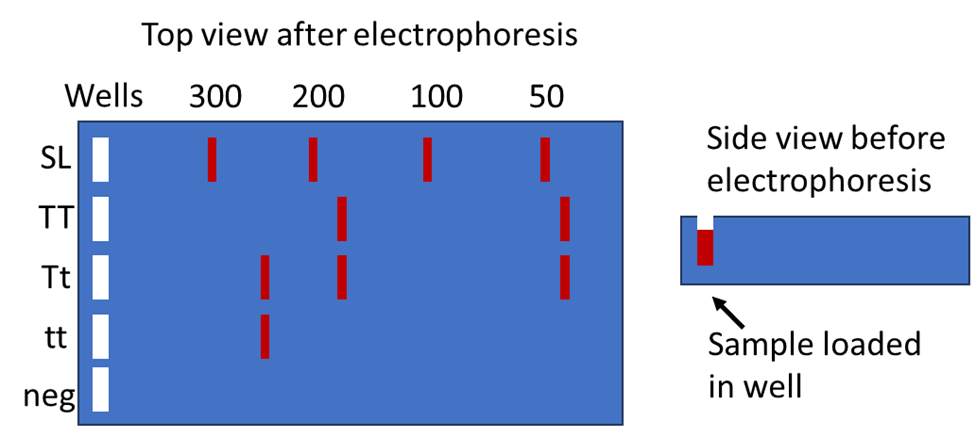
When digesting the PCR products of an individual with HaeIII, three different patterns of fragments are possible depending on the genotype. TT individuals would have two different fragments of length 44 bp and 177 bp, tt individuals would have one fragment with length 221 bp, and heterozygous Tt individuals would have three fragments of length 221 bp, 177 bp, and 44 bp. To visualize these patterns, agarose gel electrophoresis will be used to separate DNA fragments based on length (Figure 4). Agarose gel electrophoresis will be explained below.

Agarose Gel Electrophoresis
After the PCR reaction has been completed, agarose gel electrophoresis can be used to evaluate successful DNA amplification. An agarose gel contains a matrix of pores which enables the separation of DNA fragments based on their sizes. Large DNA fragments migrate more slowly than small fragments.
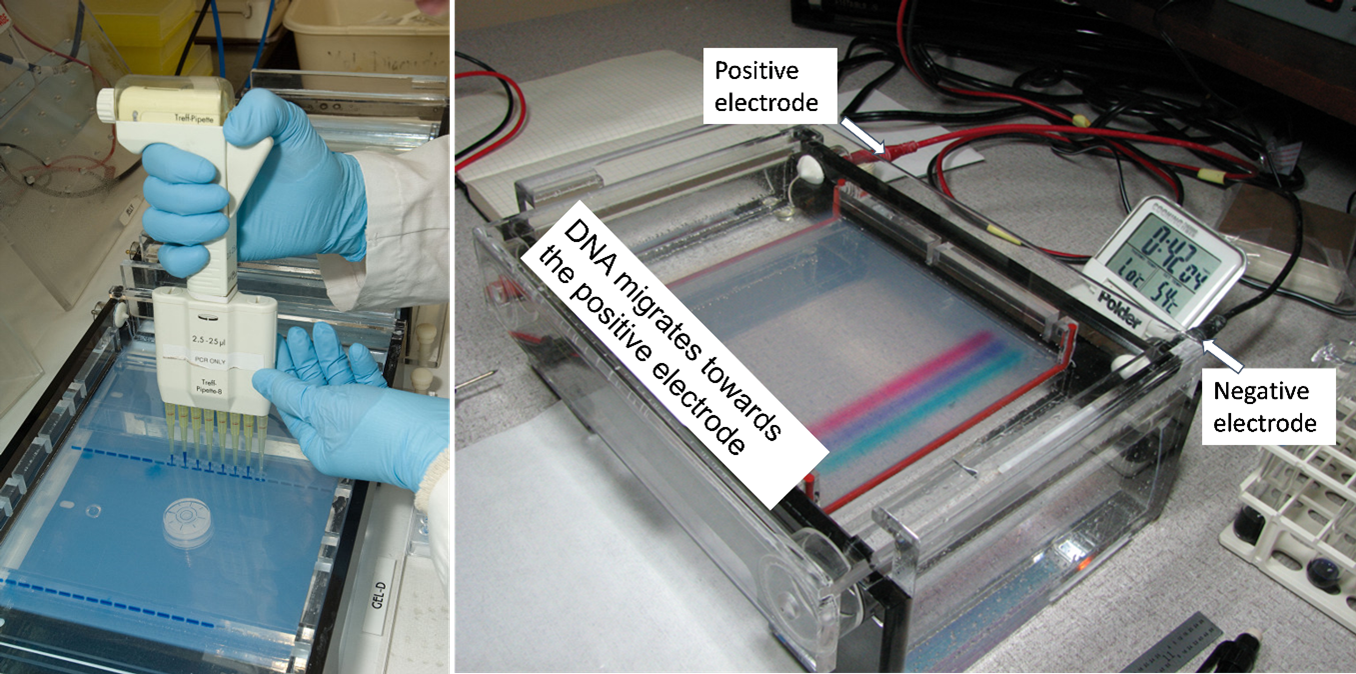
Figure 5 shows an agarose gel being loaded with DNA samples (left) and an agarose gel that is ‘running’ (right). To run the gel, it is placed in an aqueous solution of electrolytes so that an electric current can move the negatively charged DNA fragments towards the positive electrode. A loading buffer/dye is added before loading to increase sample density such that it will sink to the bottom of the well (figure 4 right). The dye allows for the tracking of the DNA’s progression through the gel.

DNA molecules must be stained to be visible to our eyes. Various dyes such as ethidium bromide are used for this purpose, DNA molecules will fluoresce when viewed with ultraviolet light. When the tracking dyes have migrated an adequate distance, the agarose gel is removed from the electrophoresis chamber and placed on an ultraviolet light source for visualization and photography. A single visible ‘band’ such as a PCR-amplified product contains millions of copies of the same DNA fragment. DNA fragments will remain in their lane where they were first loaded such that numerous samples can be analyzed on the same gel. The size ladder is used to estimate the lengths of the experimental DNA fragments.

